client

Three experiments deal with the new technical and interactive possibilities for data and augmented reality. The learnings of the self-initiated side project were documented in a Medium article and interview in the graphic design magazine Novum.
Team
Sebastian Lühr (Sadowski)
Release
May 2018
Interested? REad
EXPERIMENTS Intro
3D Maps and 3D Scatterplot in Augmented Reality
Data visualized on maps and scatterplots tend to show many data points at once – let's find out if AR could help with an overview and exploration of data.
1. Experiment
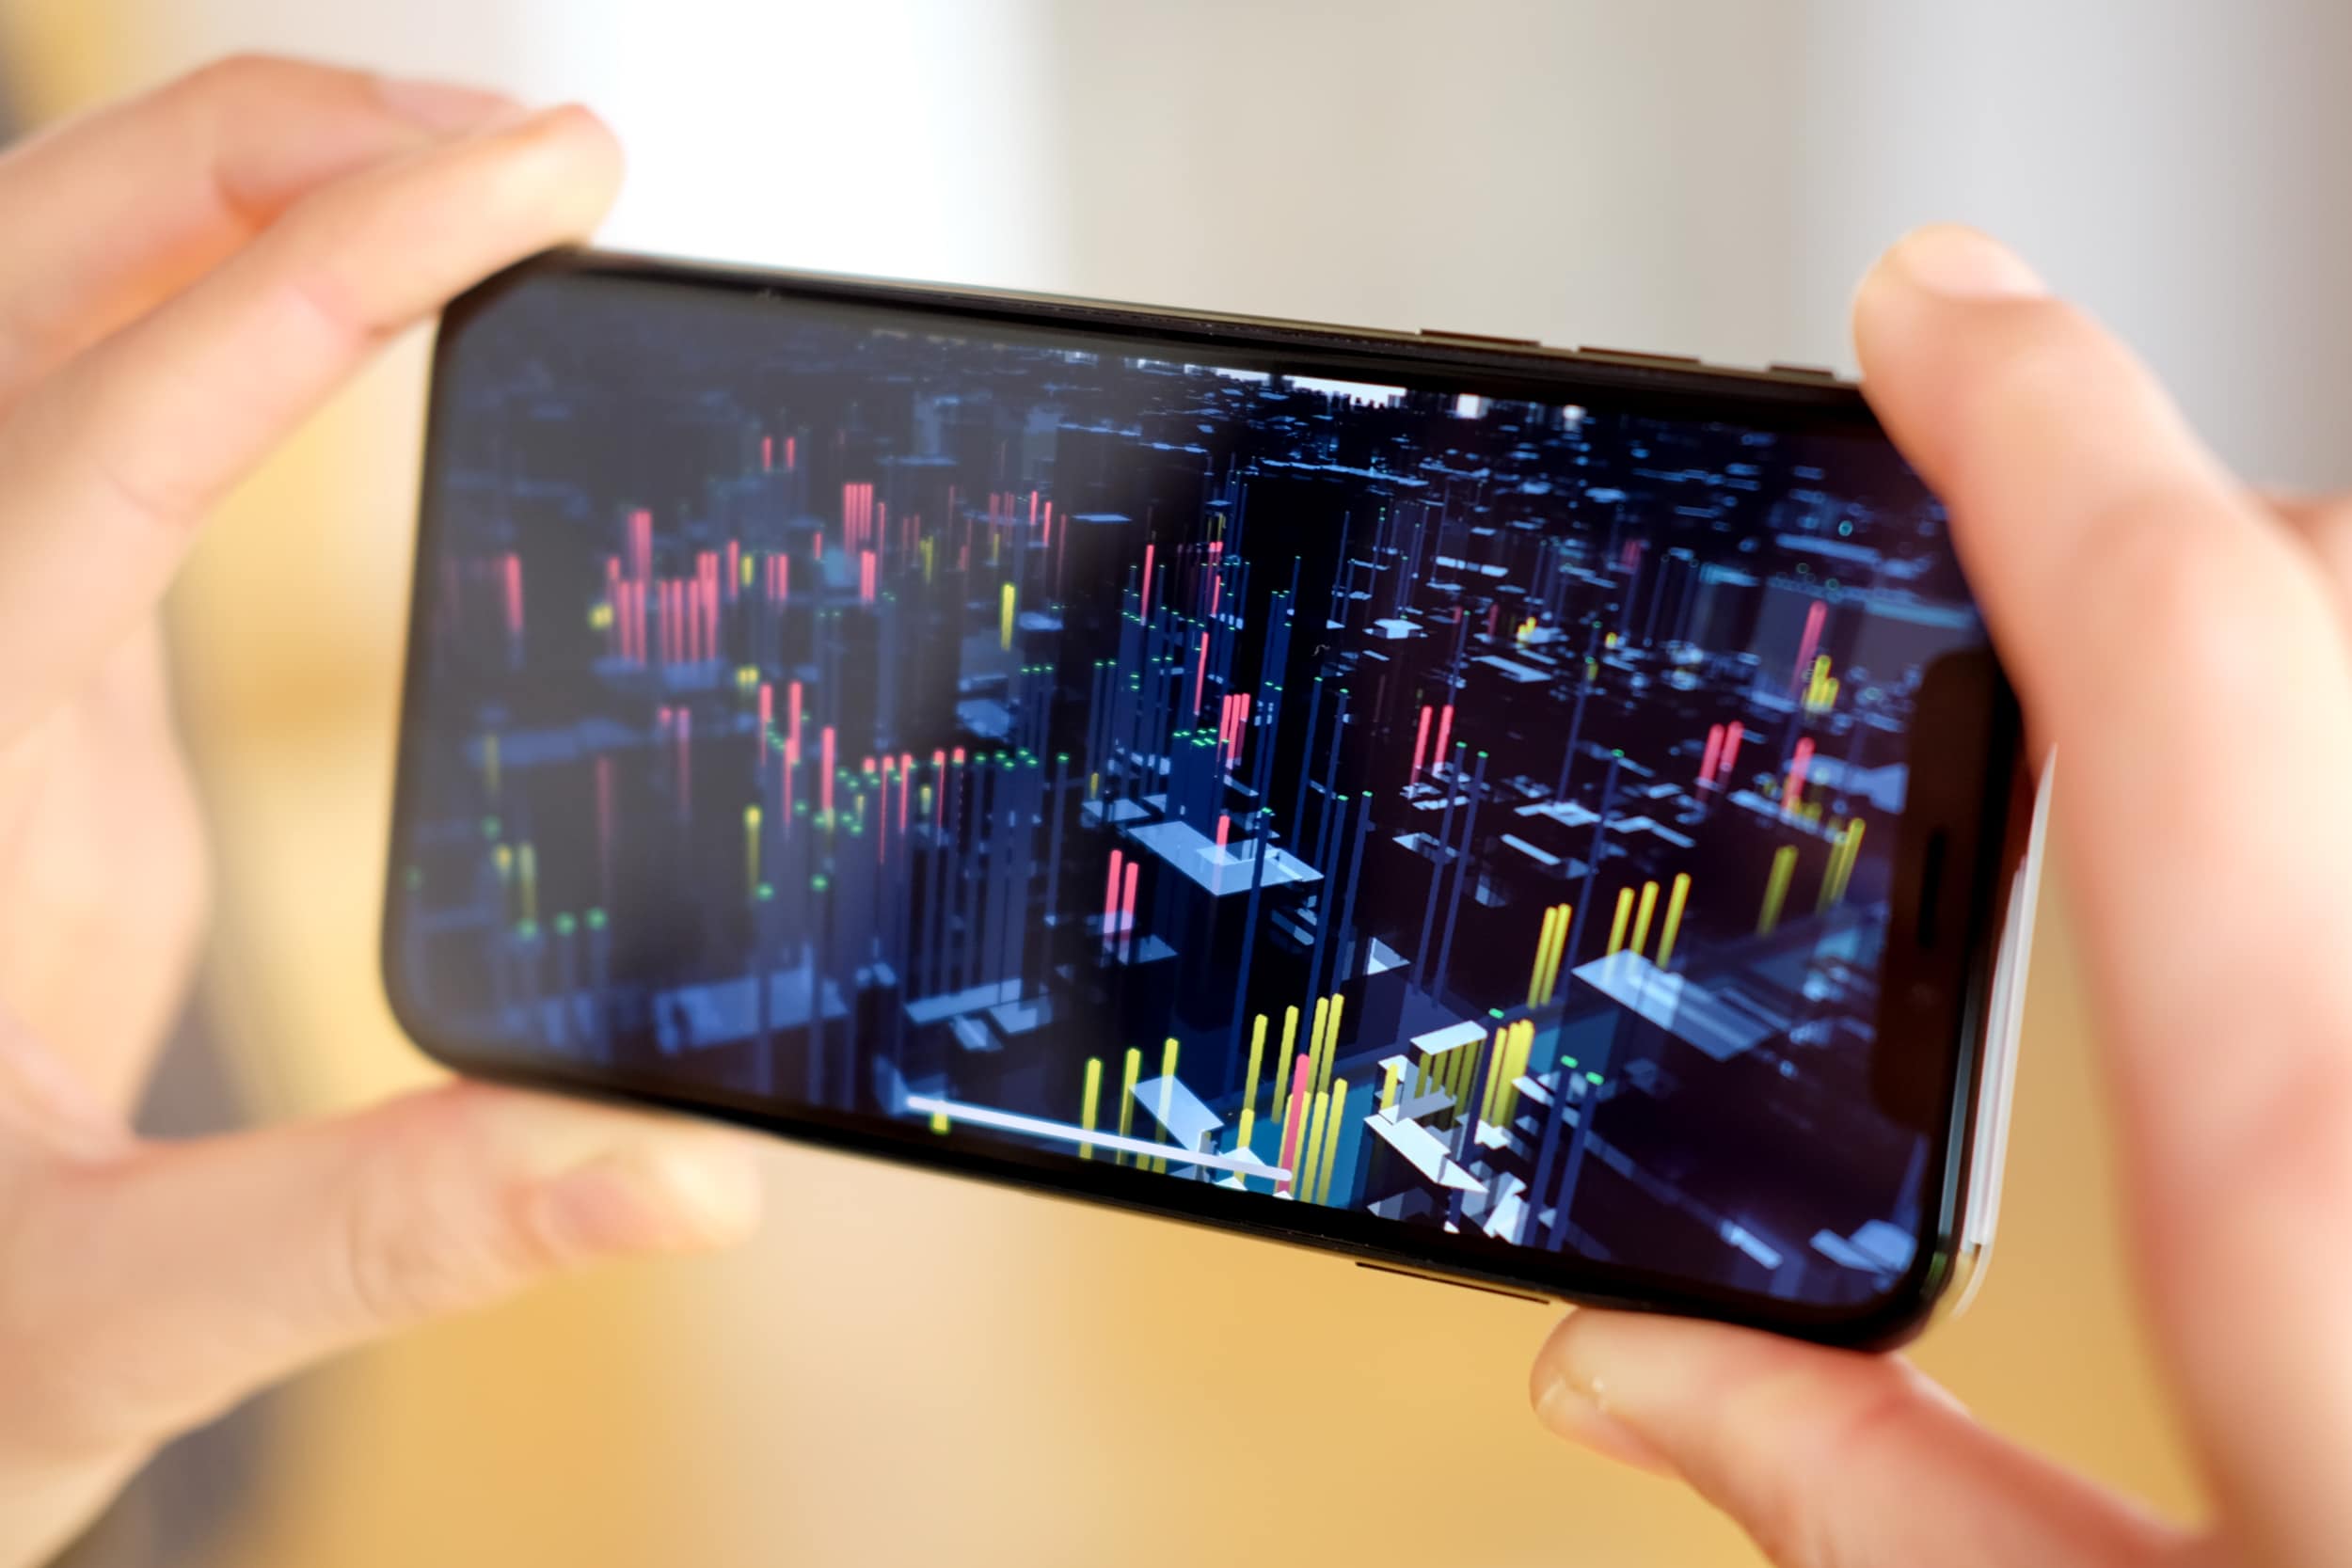
Explore the Top 3 street trees in New York with AR
The top 3 most common street trees in Manhattan are summing up to over 24k trees. We mapped all of them on a 3D map and let an iPhone user "fly over the city" to see patterns and physically move down to a street level to see different trees side-by-side.
We were impressed of the amount of data that can be fluidly visualized in AR with an iPhone: over 24k data points consisting of 12k Honeylocust (green bars), 7k Callery pear (red bars) and 5k Ginkgo (yellow bars) trees, in addition to many 3D buildings (blue).

2. Experiment
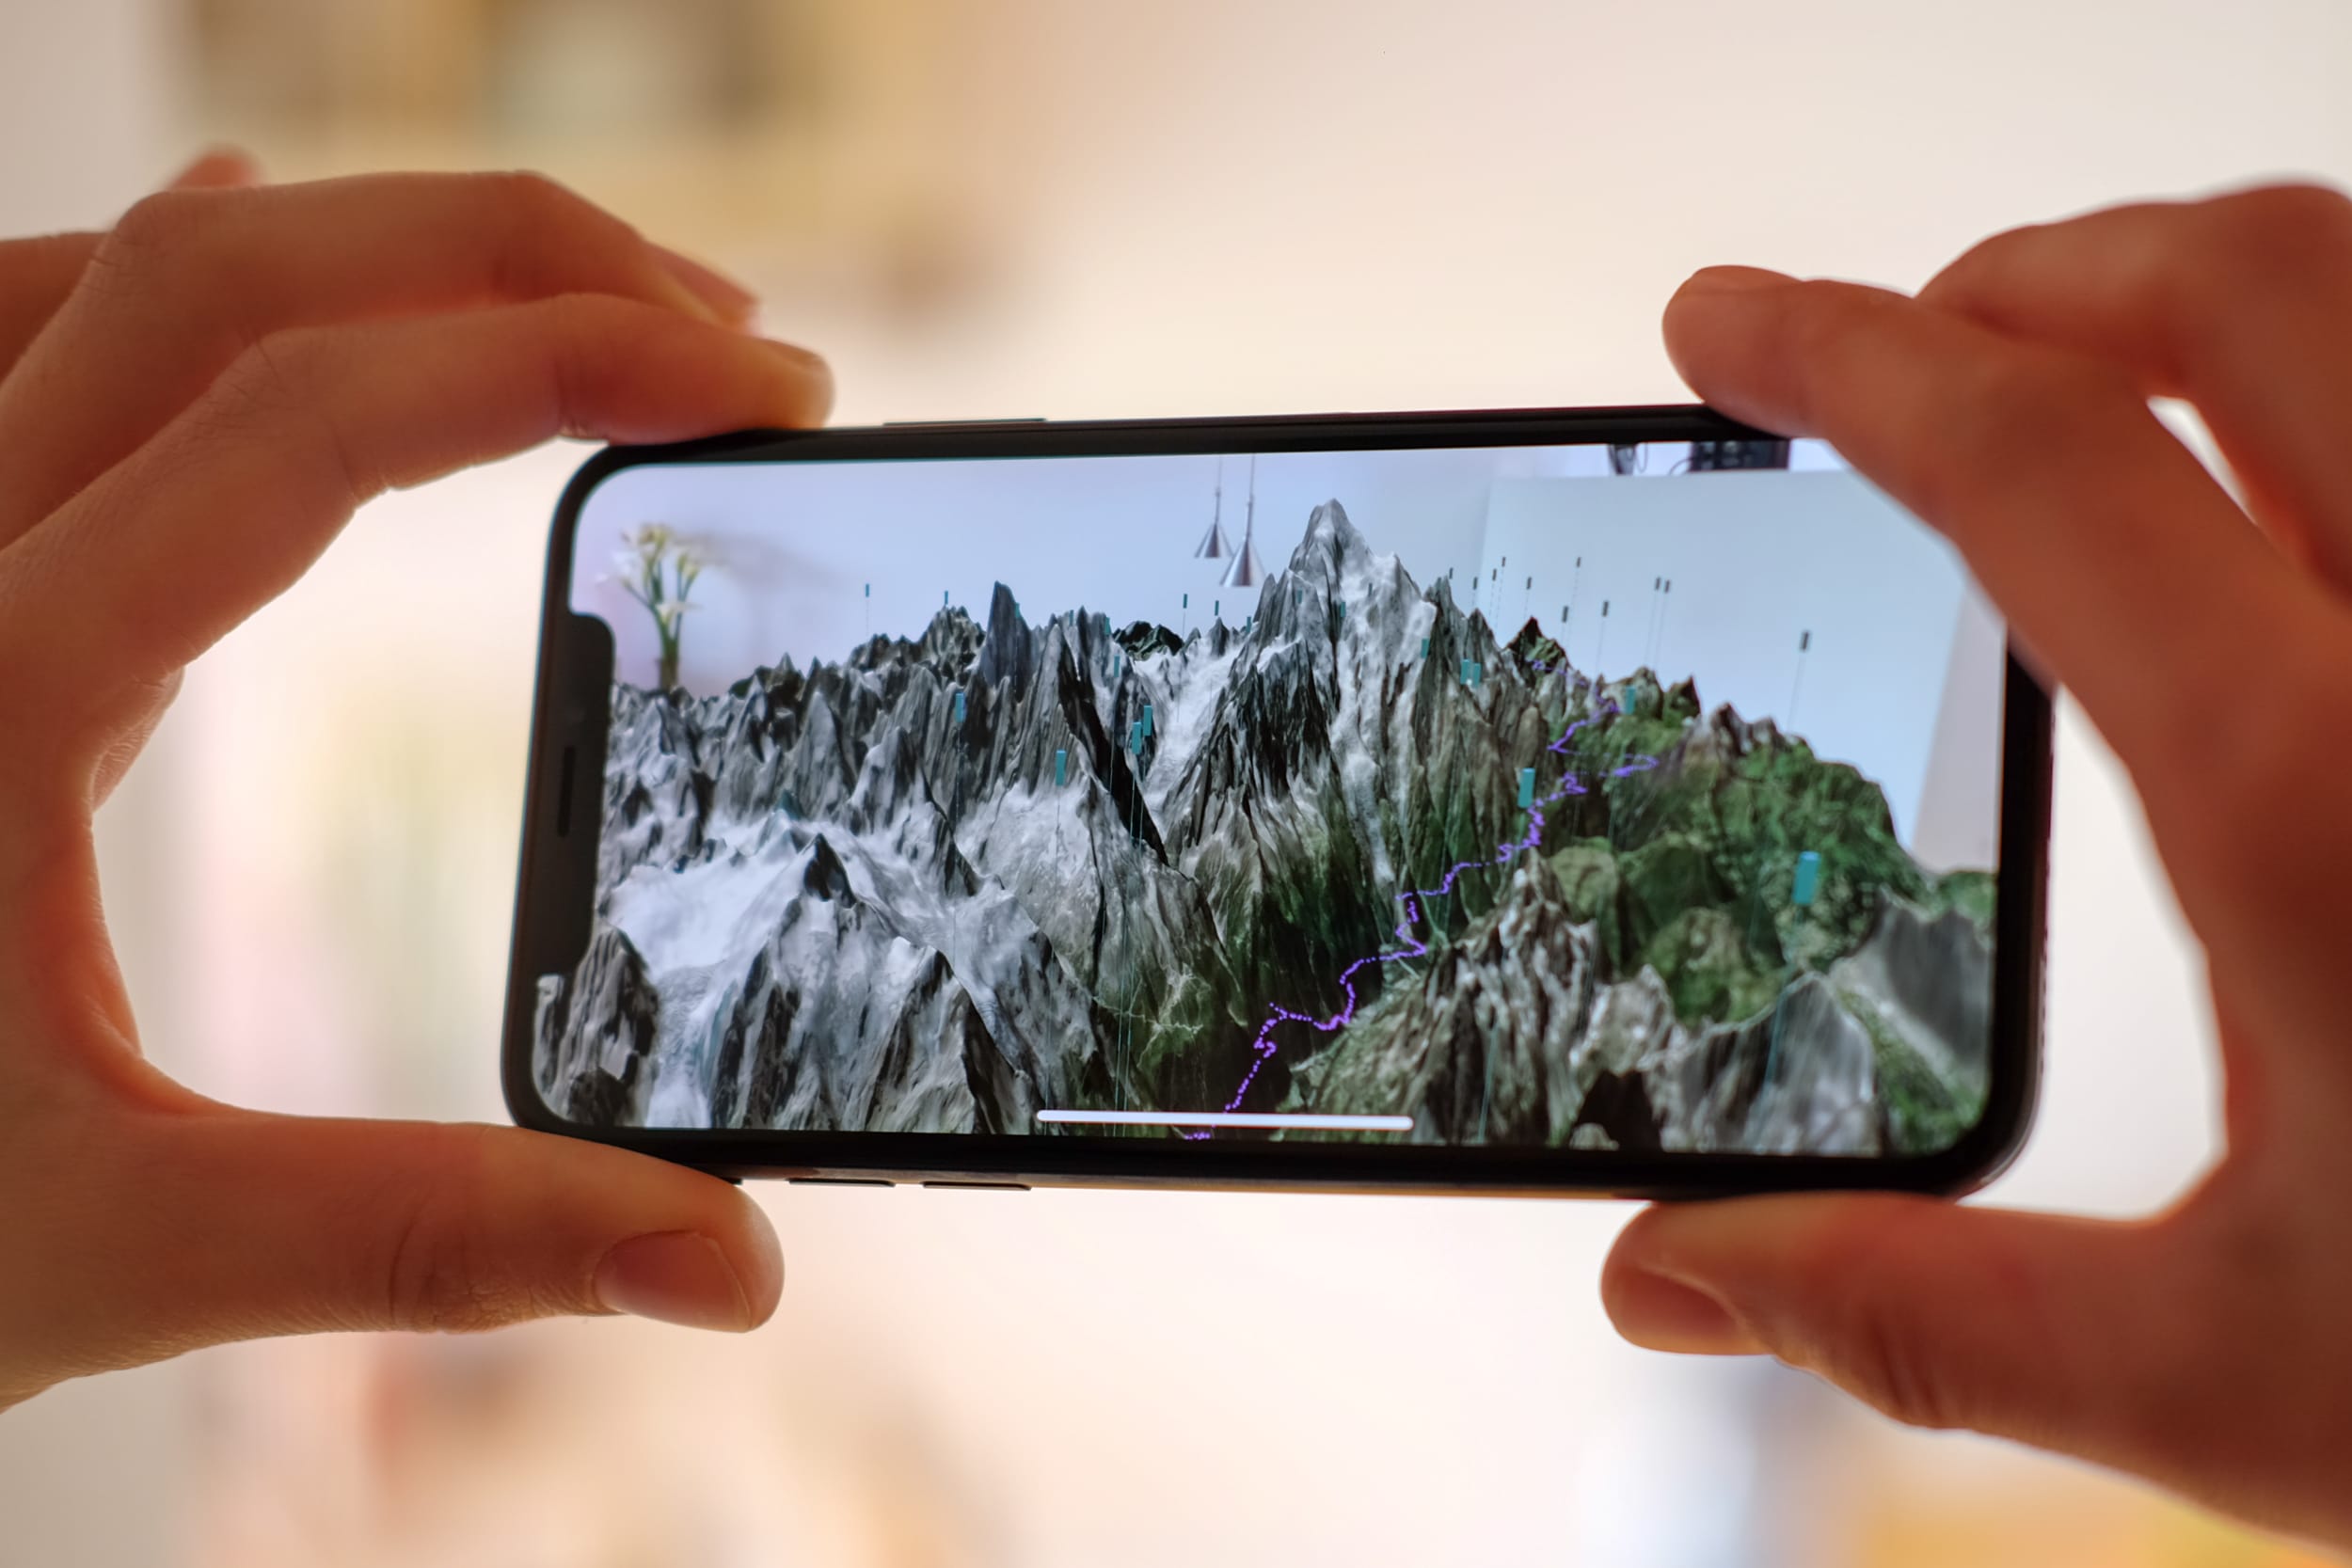
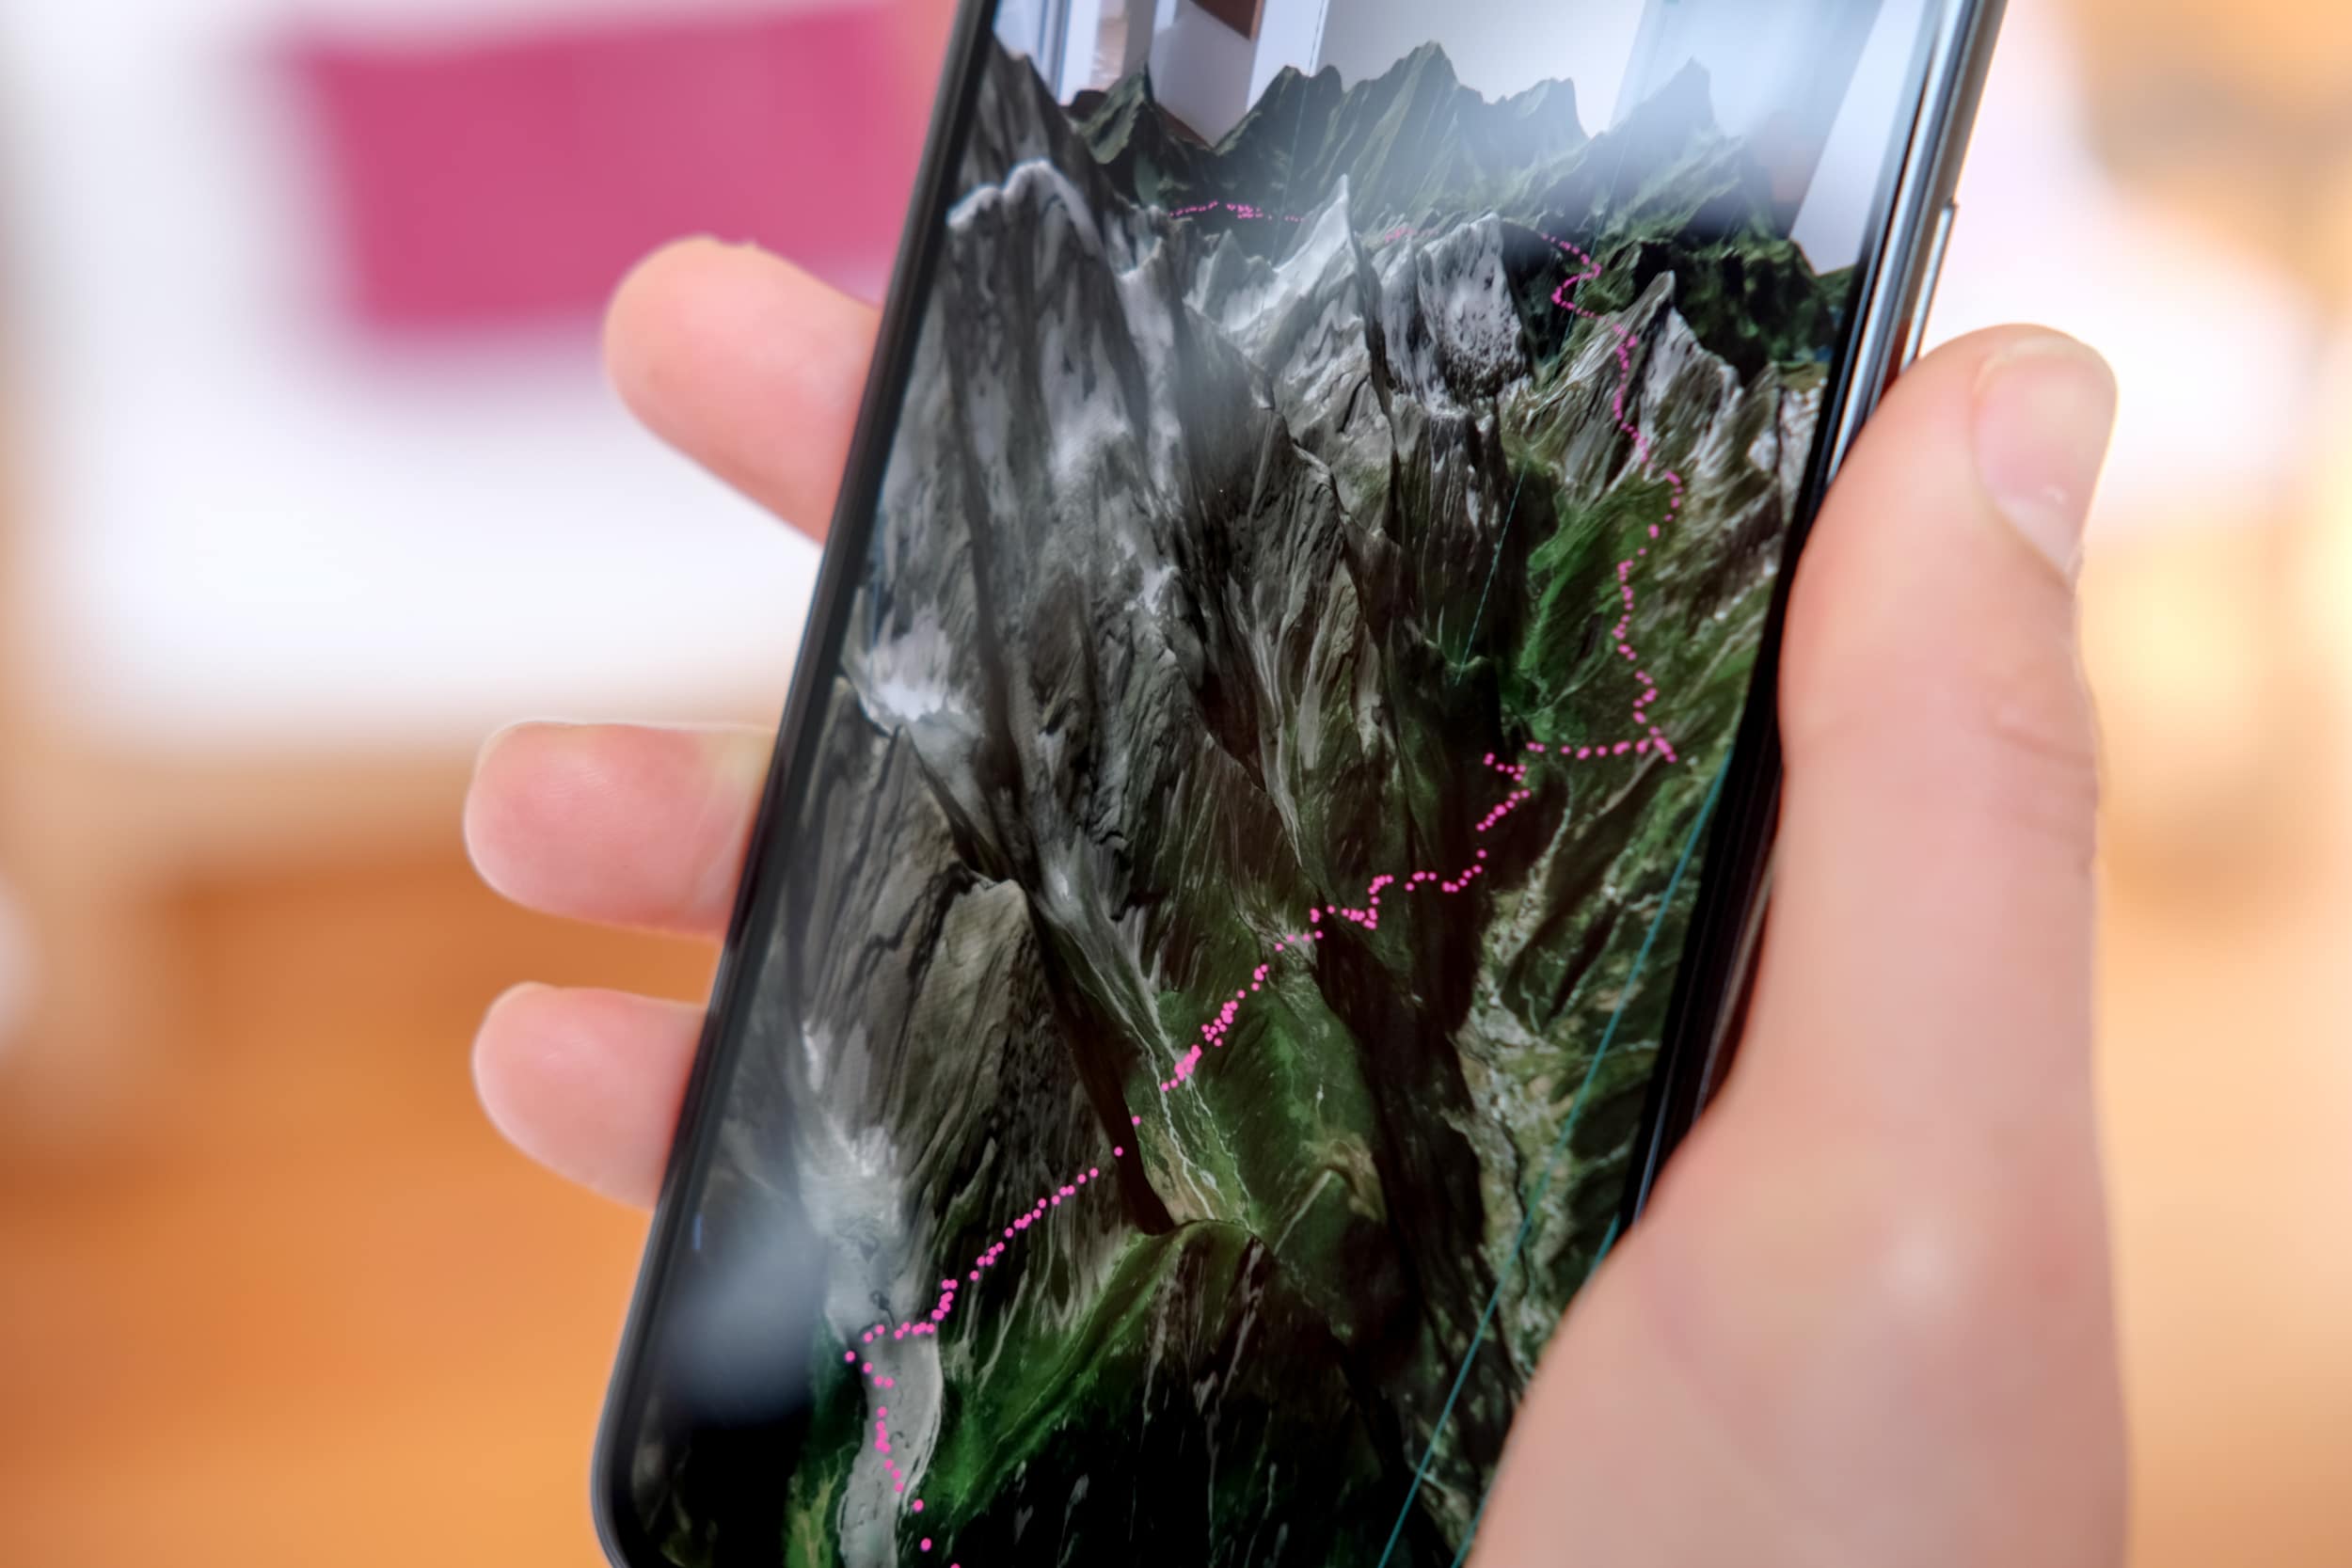
Explore a hiking route and mountain huts
We mapped one of the most popular long-distance walks in Europe, the "Tour du Mont Blanc" (170kms with 10 km elevation) with pink GPS markers and green markers for the mountain huts along the route.
Looking at the route and the mountain massif with AR provided another feeling for the terrain and enhanced a playful exploration while moving closer and further away from the mountains with the smartphone, similar to zooming in and out of a map.
Another fun experience was to map the whole terrain in a larger scale into the garden and literally walk the route along the hike.
GET STARTED
How to get started with data visualizations on maps in augmented reality?
The Mapbox SDK for Unity, Unity and a newer iPhone or an iPad works quite well together. To get started, I can recommend creating a map in Unity first and then read the article on the Mapbox Blog. Unity is sometimes quite a pain with an outdated, complicated interface and coding isn't easy either. Nevertheless, it's quite powerful and works well together with the new augmented reality features from Apple.


3. Experiment
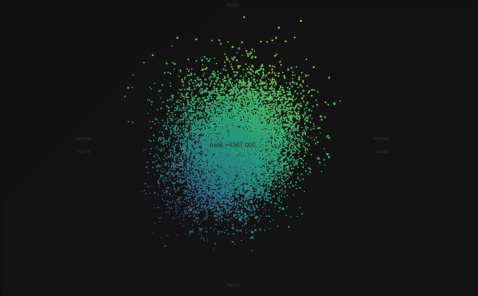
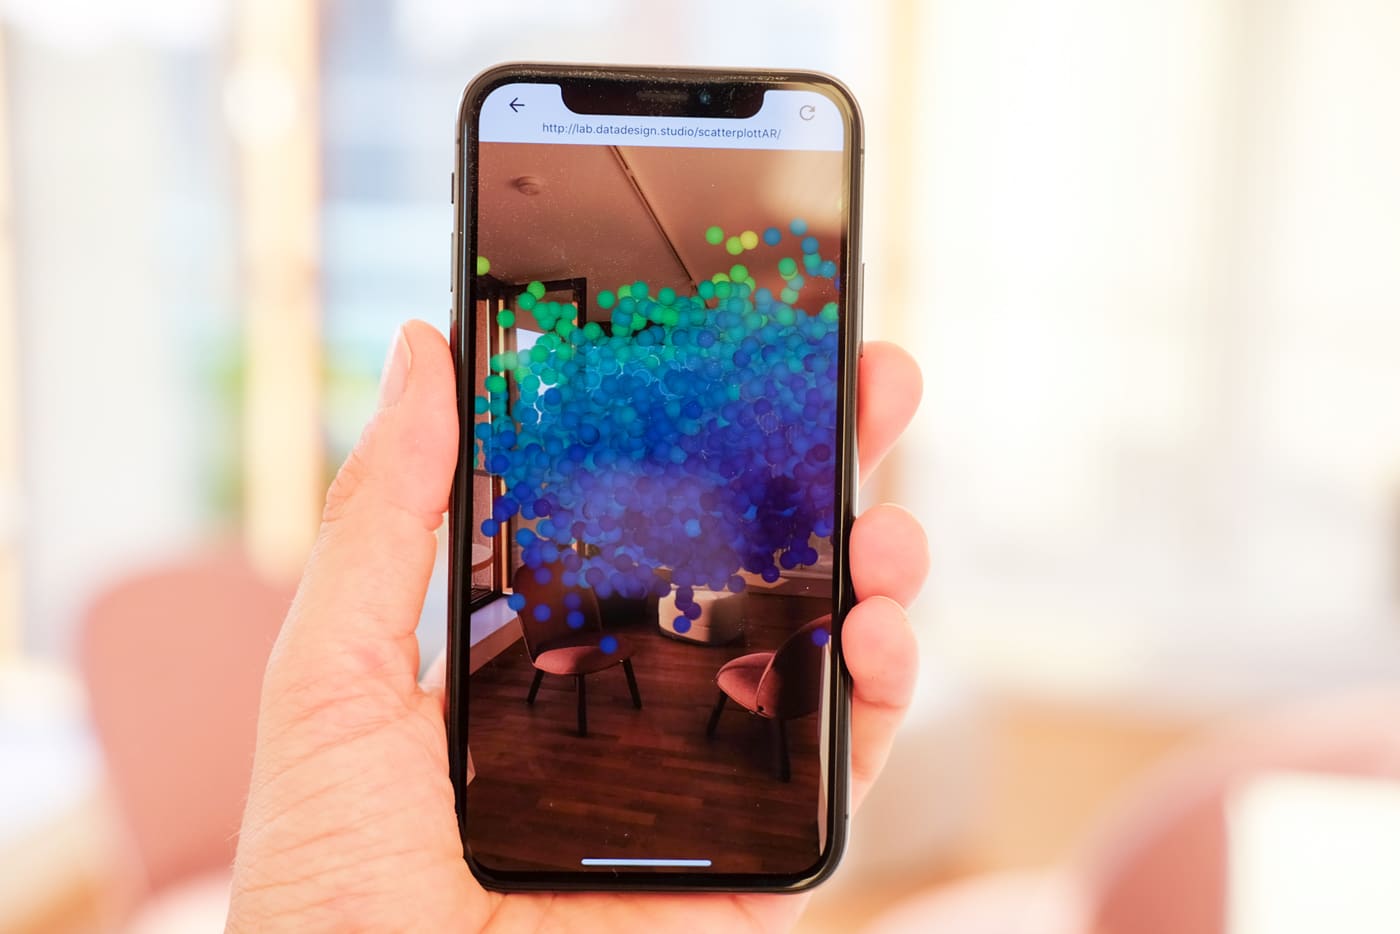
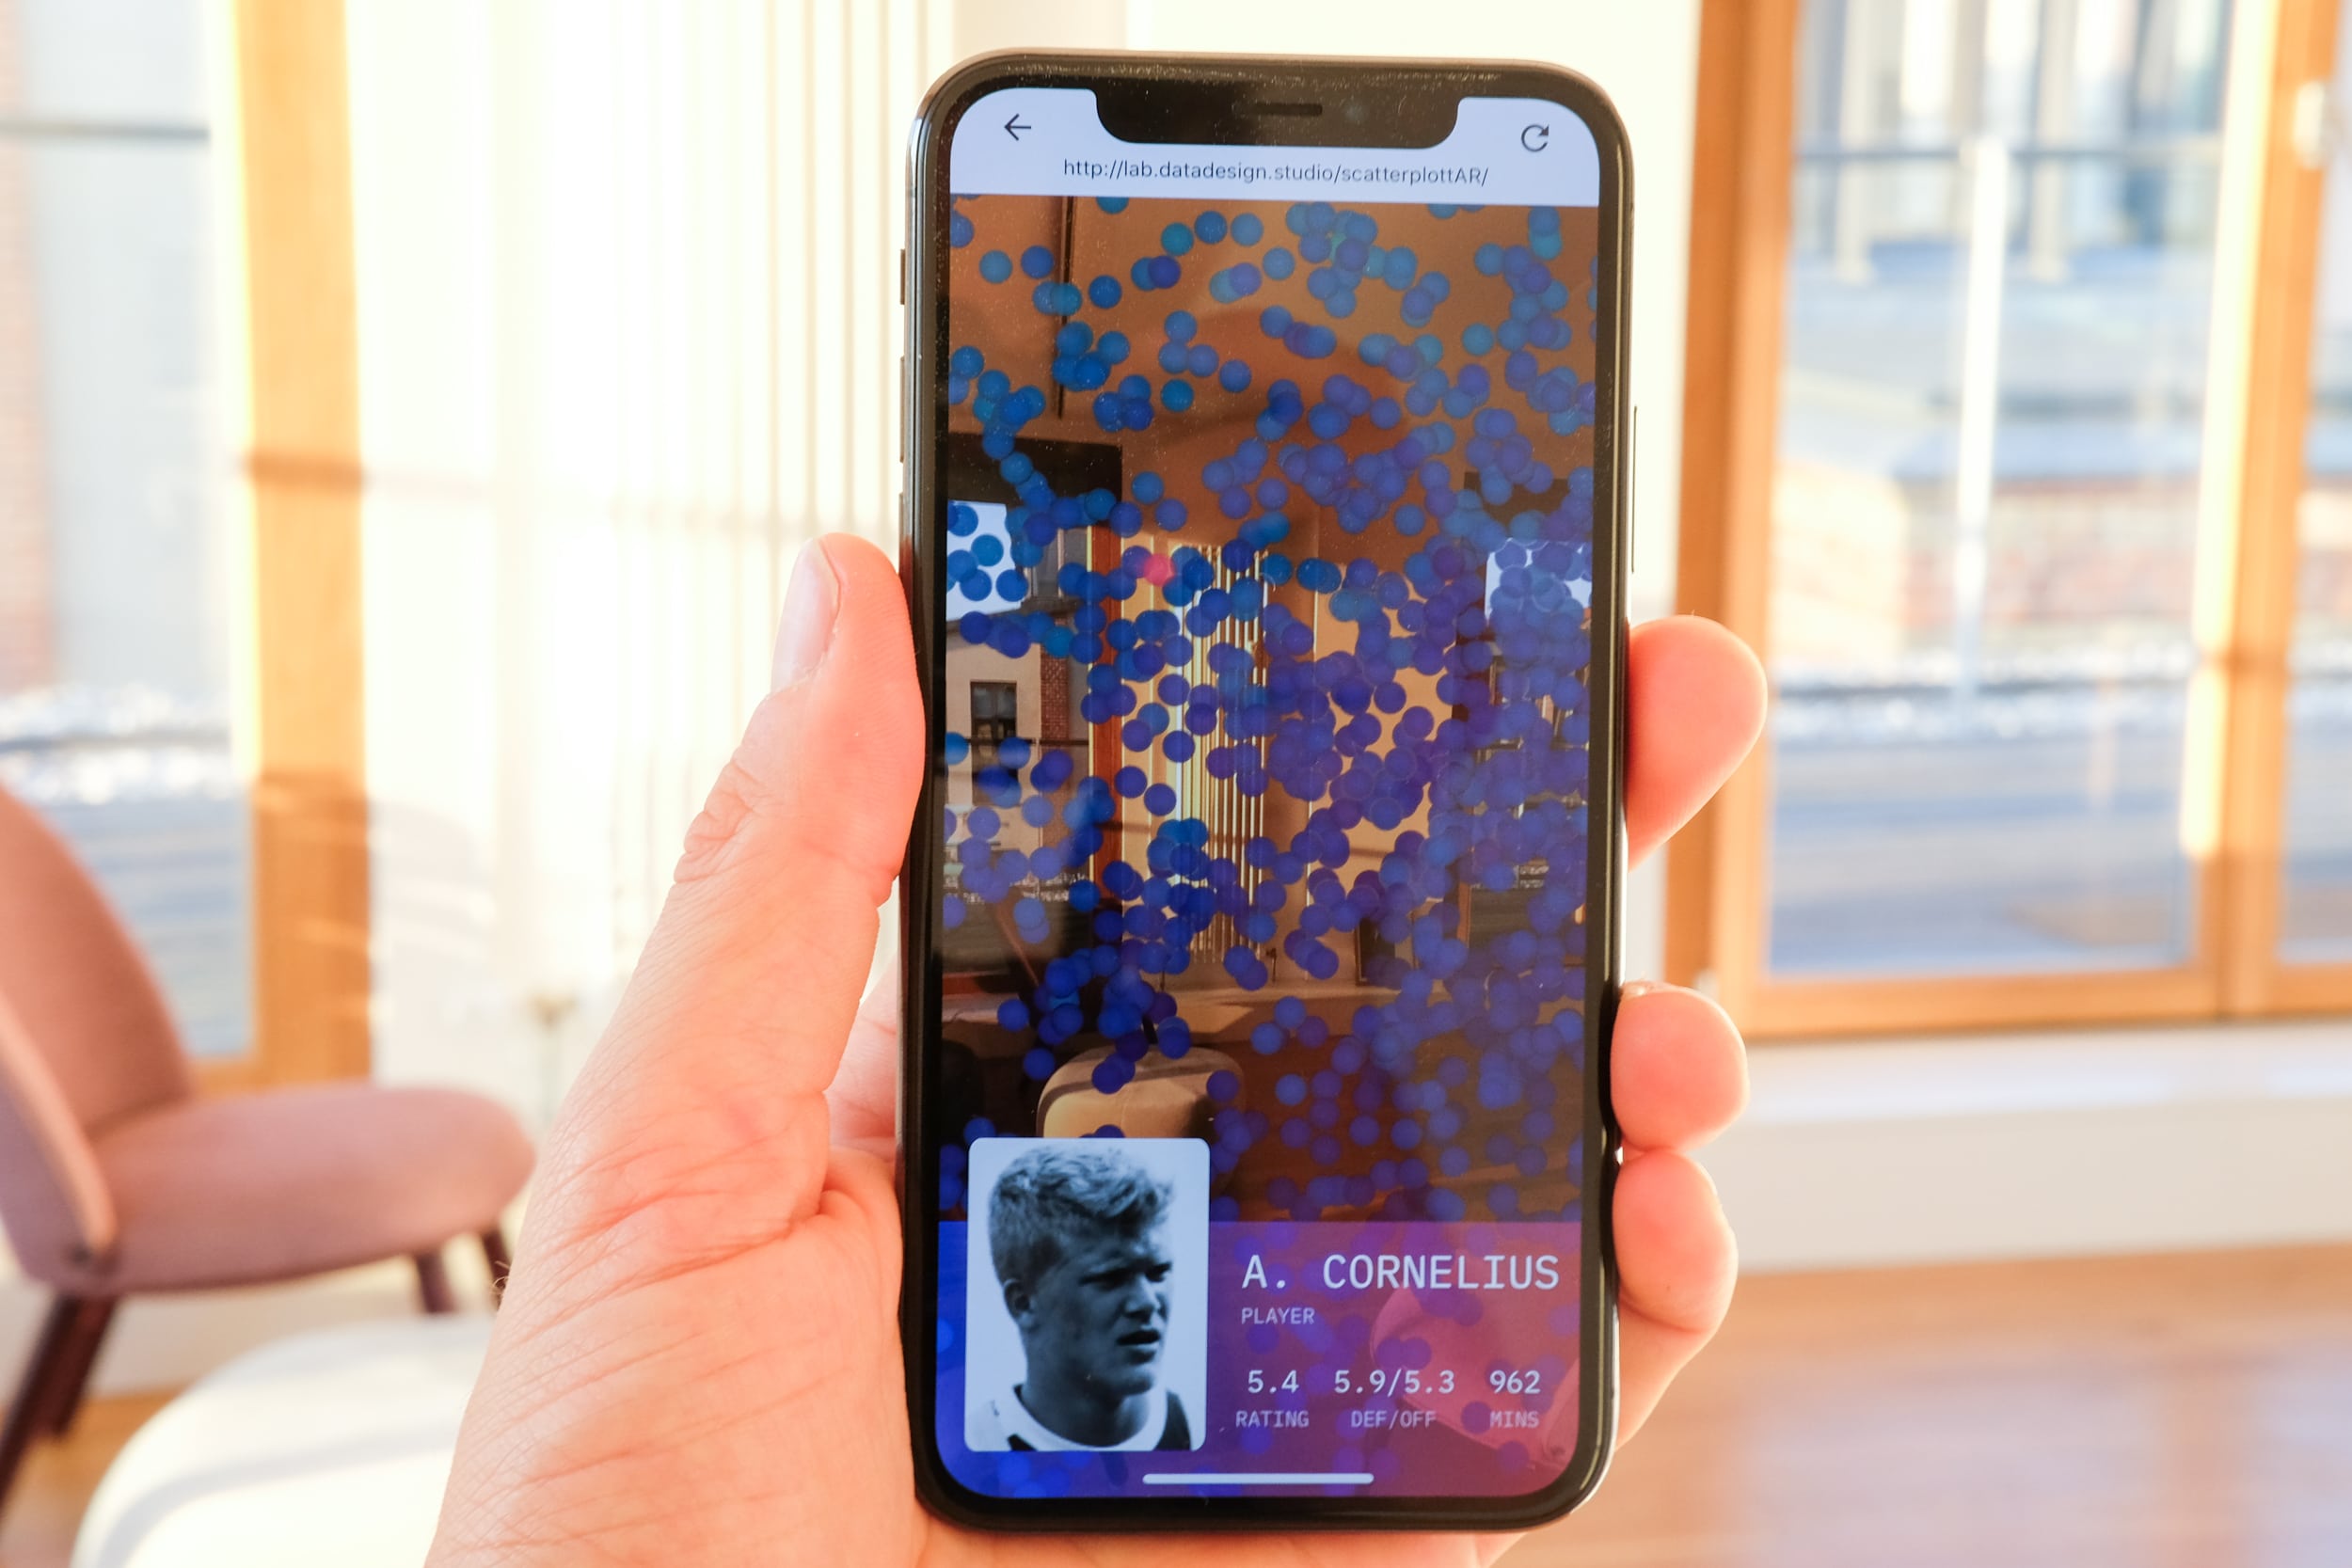
Explore 10k football players
We visualized data about 10k football players with a 3D scatterplot in a physical space. On the x-axis we put data about the player's defence, y-axis offence and z-axis minutes played data. The color highlights the overall rating. The user could get more information about a data point by pointing to a dot or tap on it on the smartphone screen.
The immersive web-experience has been implemented with three.ar.js – a three.js library for building AR web experiences that run in WebARonARKit and WebARonARCore.
shared insights
Featured in Novum - World of Graphic Design and on Medium


Get in touch to discuss what we could do for you.
© DataDesign Studio 2022. . All rights reserved.
For company information and other legal bits, see our legal page and Privacy Policy.