client

We created an interactive tool to explore predictions for the export potential of more than 220 countries and 4,000 products for the International Trade Centre – a joint agency of the World Trade Organization and the United Nations.
Team
Sebastian Lühr (Sadowski)
ITC Developer Team
Release
July 2017
Interested?
insight
Make new data accessible for exporters, trade advisers and policymakers.
Data of the new Export Potential and Product Diversification Indicator generated by the ITC should be made easily accessible.

ui/ux design
Find what you need in seconds.
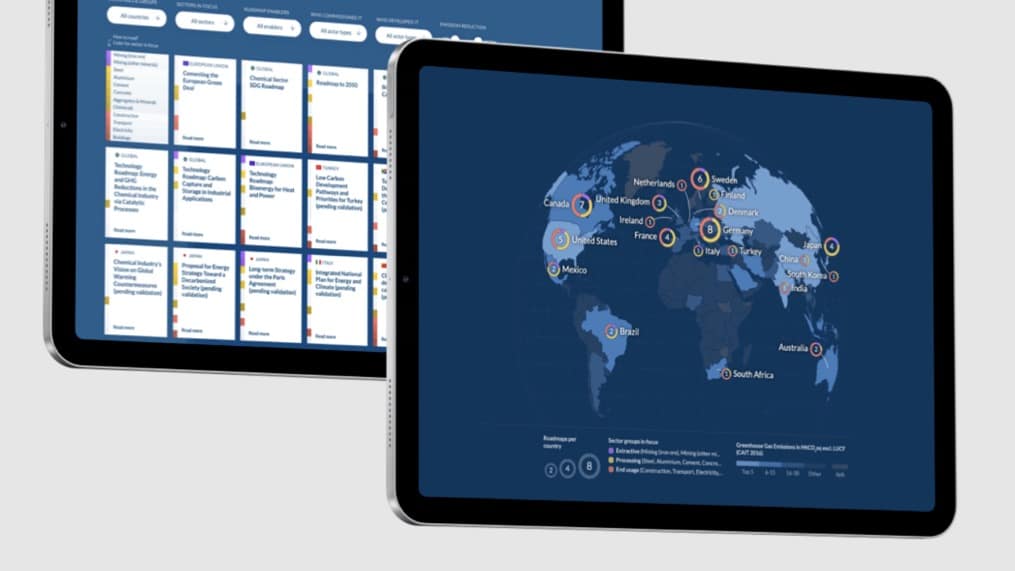
We developed an interface that separated the huge dataset into products, markets and exporters. Secondly, the user can filter for specific countries, regions, products and sectors or explore the TOP 200 values easily.


DATA VISUALIZATION DESIGN
Get new perspectives with different data visualizations.
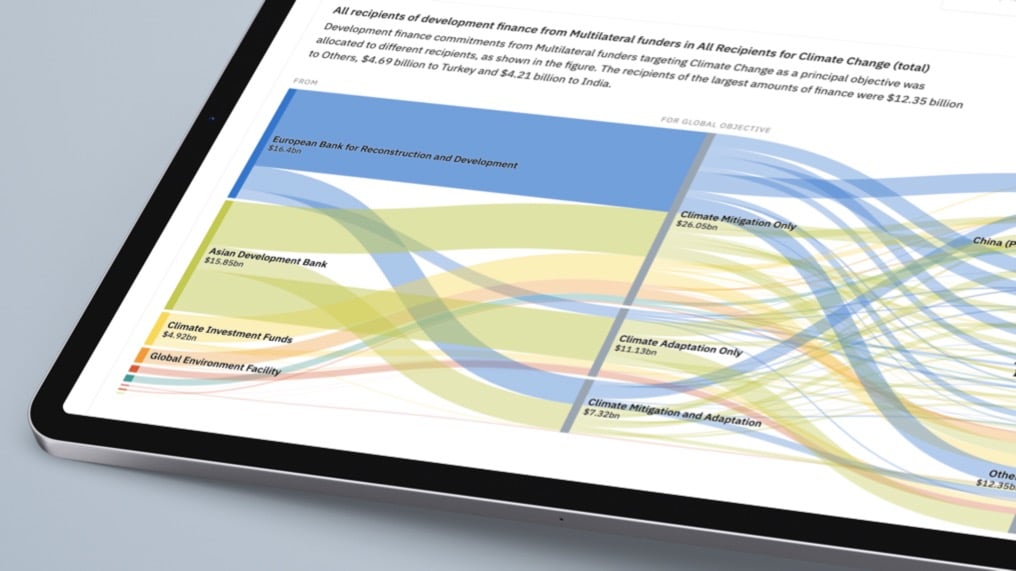
We designed different data visualizations for the same datasets to tell different stories such as the gap between the realized and export potential or the regional spread.
What we did
Explore new markets with radial dendrograms.
New visualization formats for trade development made the content even more interesting and fun to explore.

WHAT WE DID
Poster for promotion.
We designed a poster mapping the product export potential in % for each country.

An interesting tool that was developed and designed specifically for companies that operate in developing countries and that helps these firms to achieve success in these regions.
– Jury of the German Design Council. Read more...
IMPACT
The No. 1 tool for export potential and diversification information worldwide.

Visited by more than 5,000 active users per month.
Awarded with the German Design Award 2018 for one of the best web applications.
Featured in articles of the Wall Street Journal, Bloomberg and more.
Customized for countries such as Malawi, Bahrain or Greece.
Trained in on-site programs with many small to medium-sized exporters, e.g. in Egypt, Bhutan, Kyrgyzstan and more.
Embedded interactive data visualizations in official trade portals, e.g. in Mauritania.
Get in touch to discuss what we could do for you.
© DataDesign Studio 2022. . All rights reserved.
For company information and other legal bits, see our legal page and Privacy Policy.
