client
We helped the Stockholm Environment Institute to make data on development finance better accessible and transparent. Policymakers around the world use "Aid Atlas" to get new meaningful insights with interactive data visualizations.
Team
Sebastian Lühr (Sadowski)
Flavio Gortana
Release
January 2020, Ongoing
Interested?
insight
The first comprehensive and simple overview of development finance.
Hundreds of billions of dollars in global development finance are mobilized to help developing countries tackle their development deficits.
Yet the aid landscape is complex, and it can be difficult to have a clear picture of where funding comes from, where it goes, what it’s used for, and what impacts it has.
ui/ux design
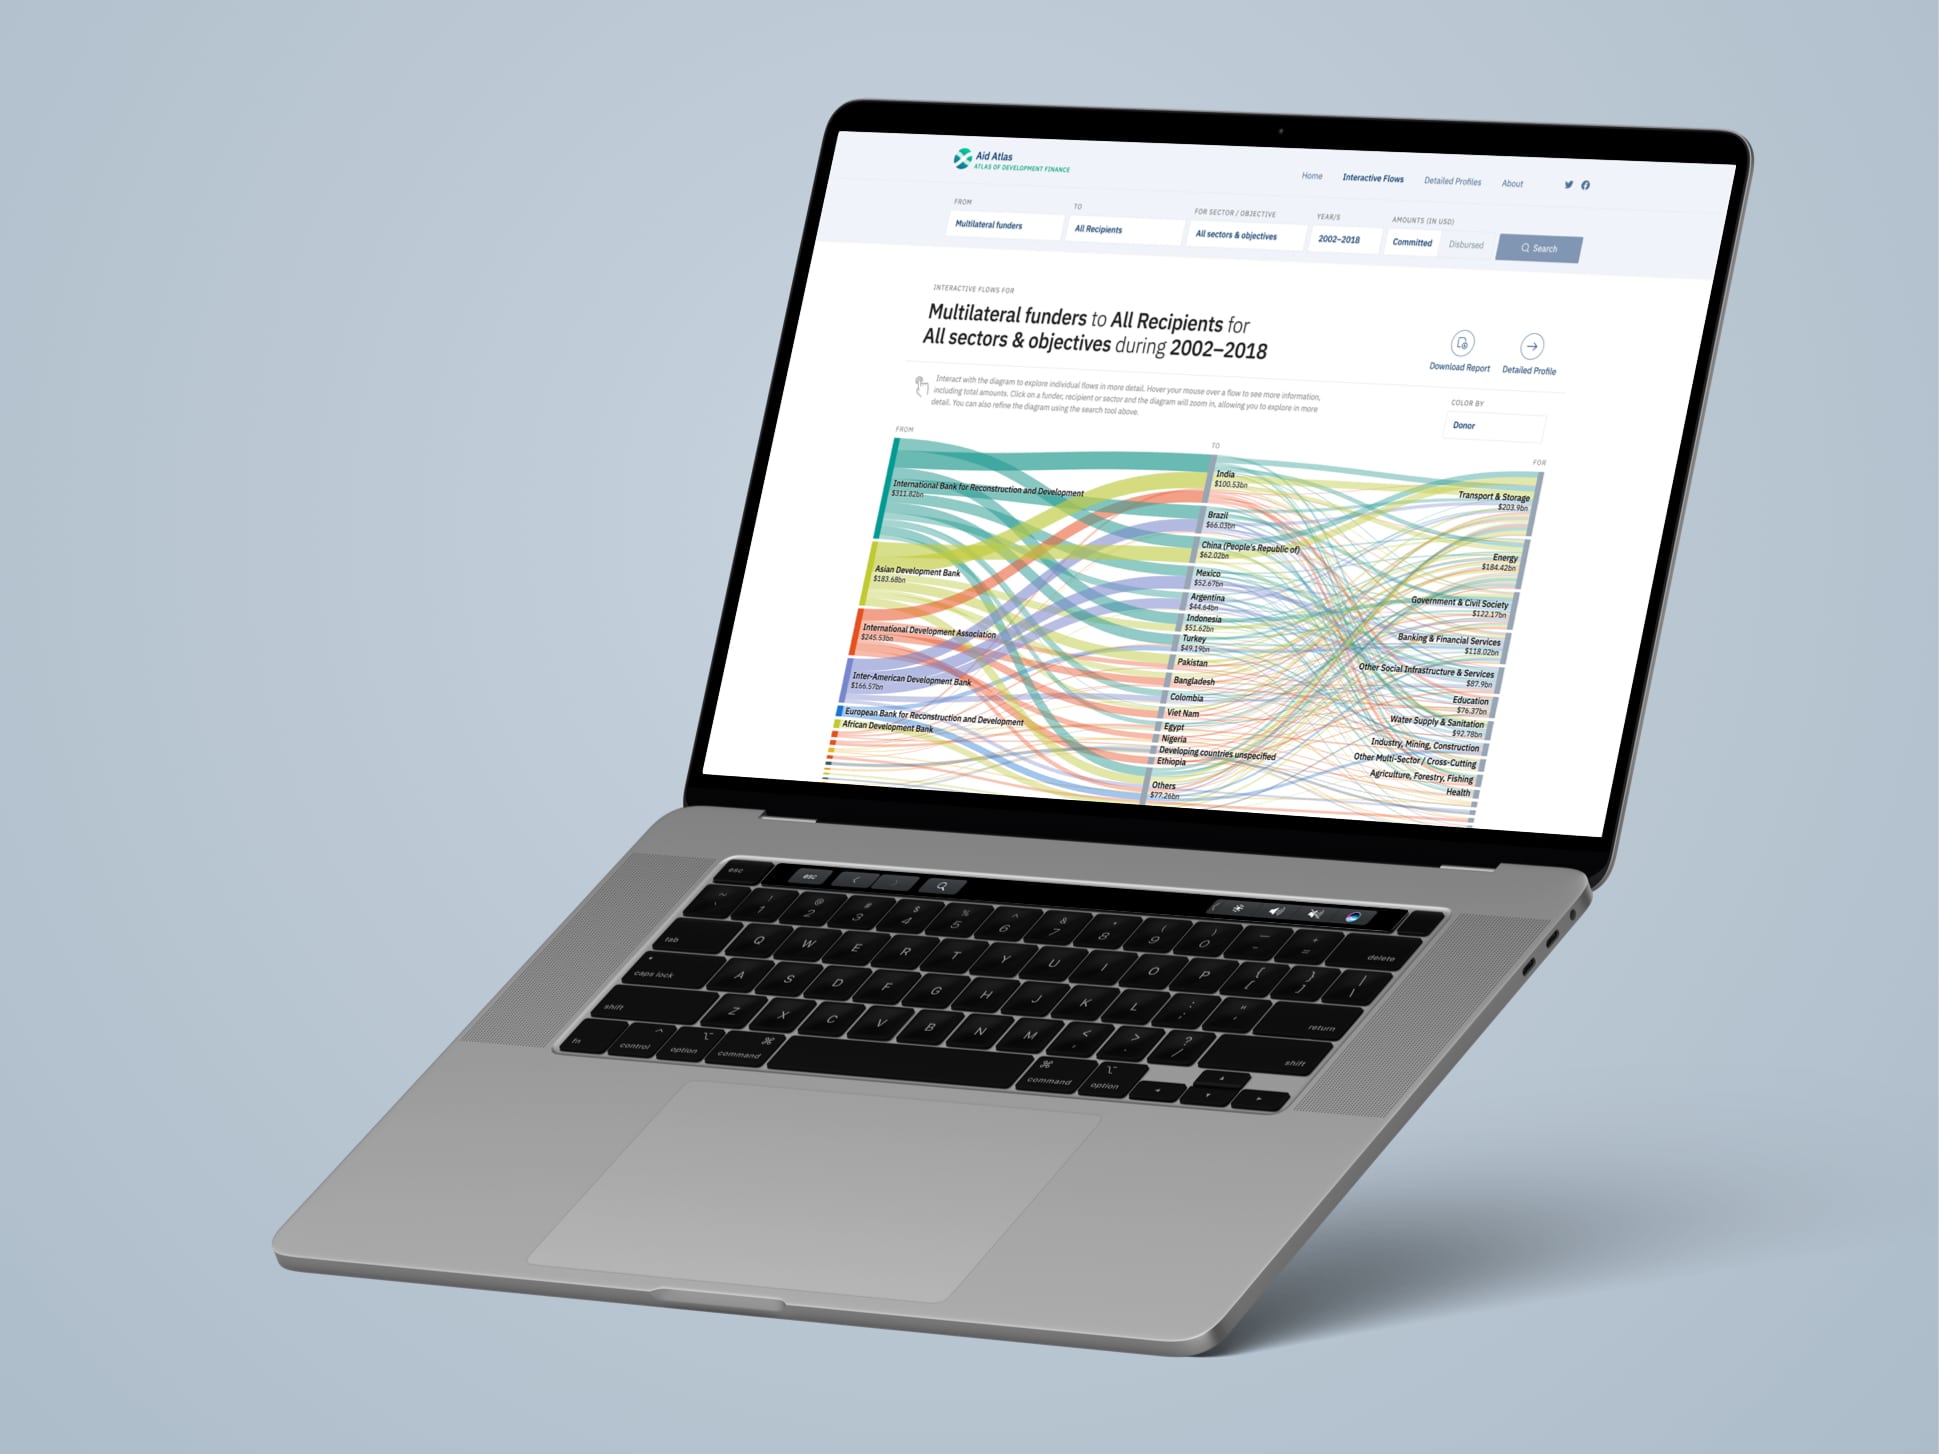
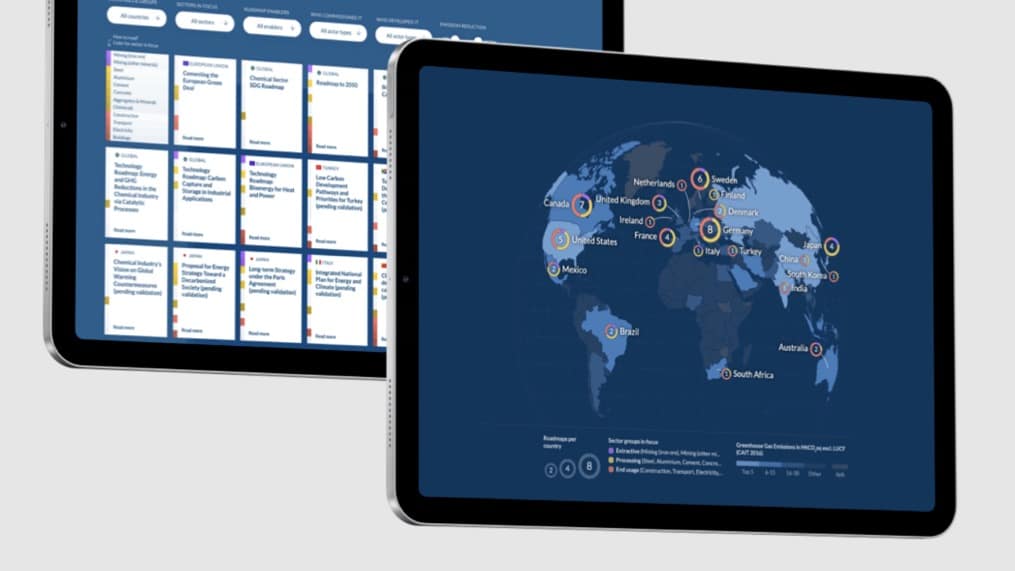
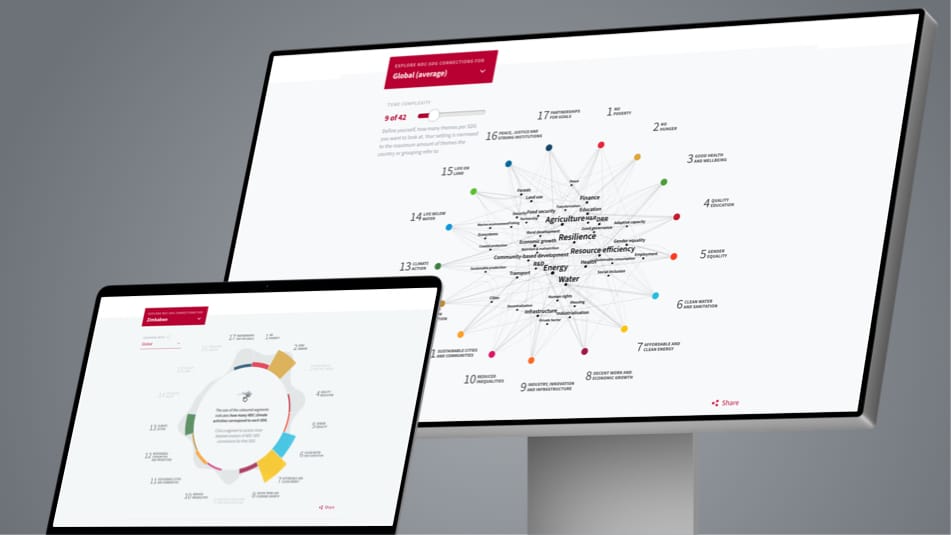
Explore and search.
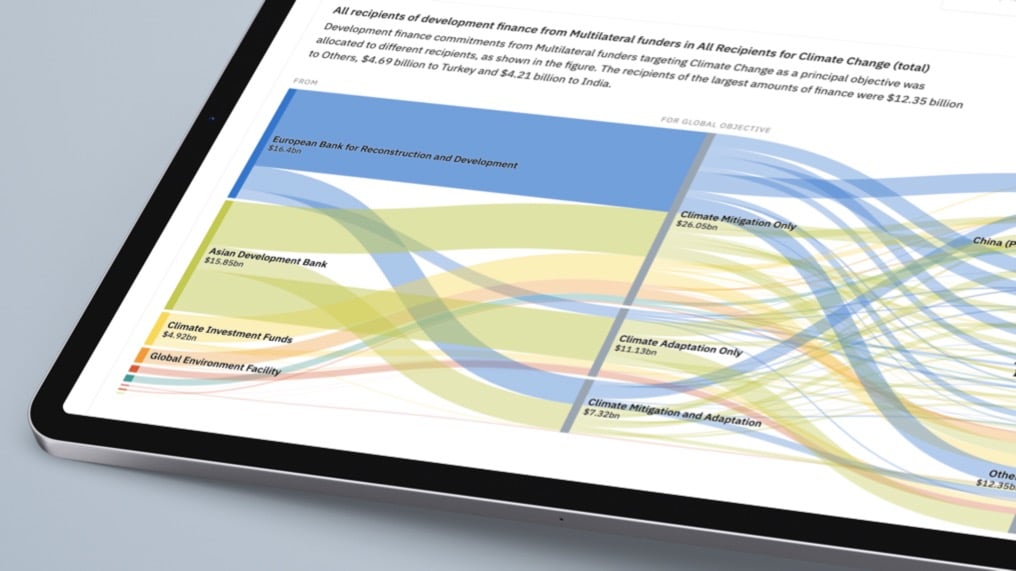
The interface enables policymakers or researchers to either explore the data with an alluvial diagram or search for something specific and get a custom profile page with visualizations of all the data available – from overview to detail.
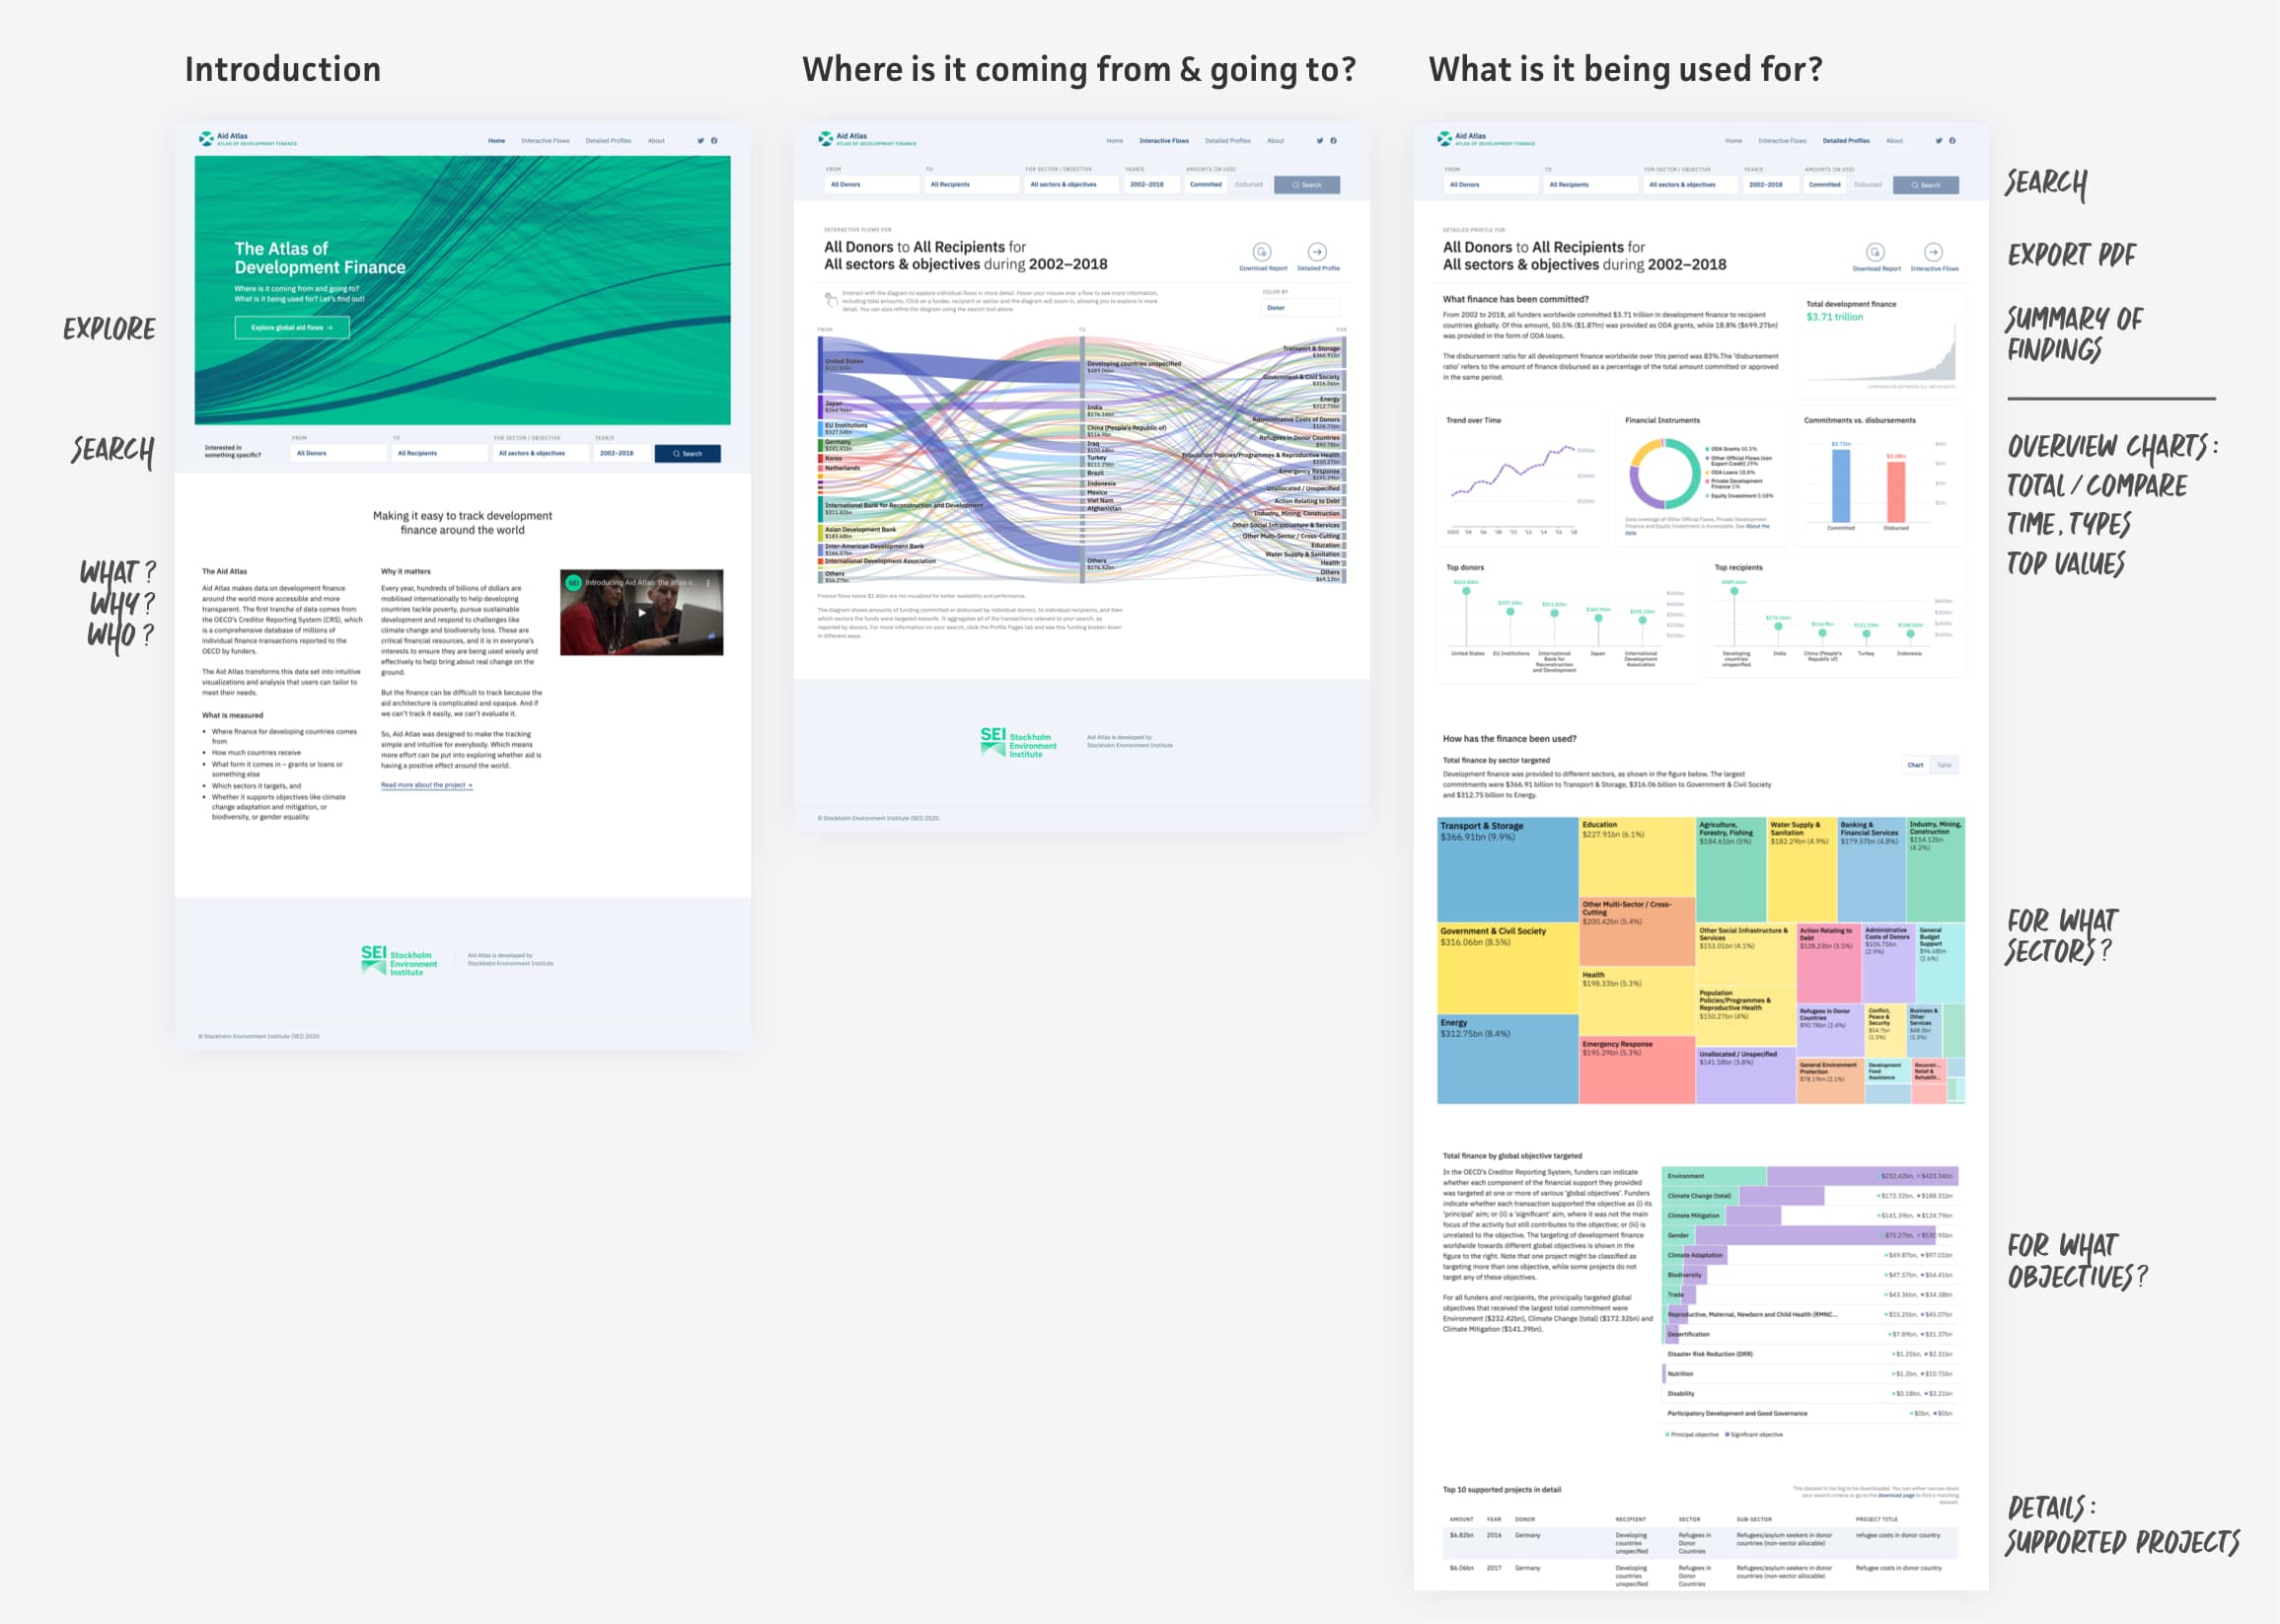
DATA VISUALIZATION DESIGN
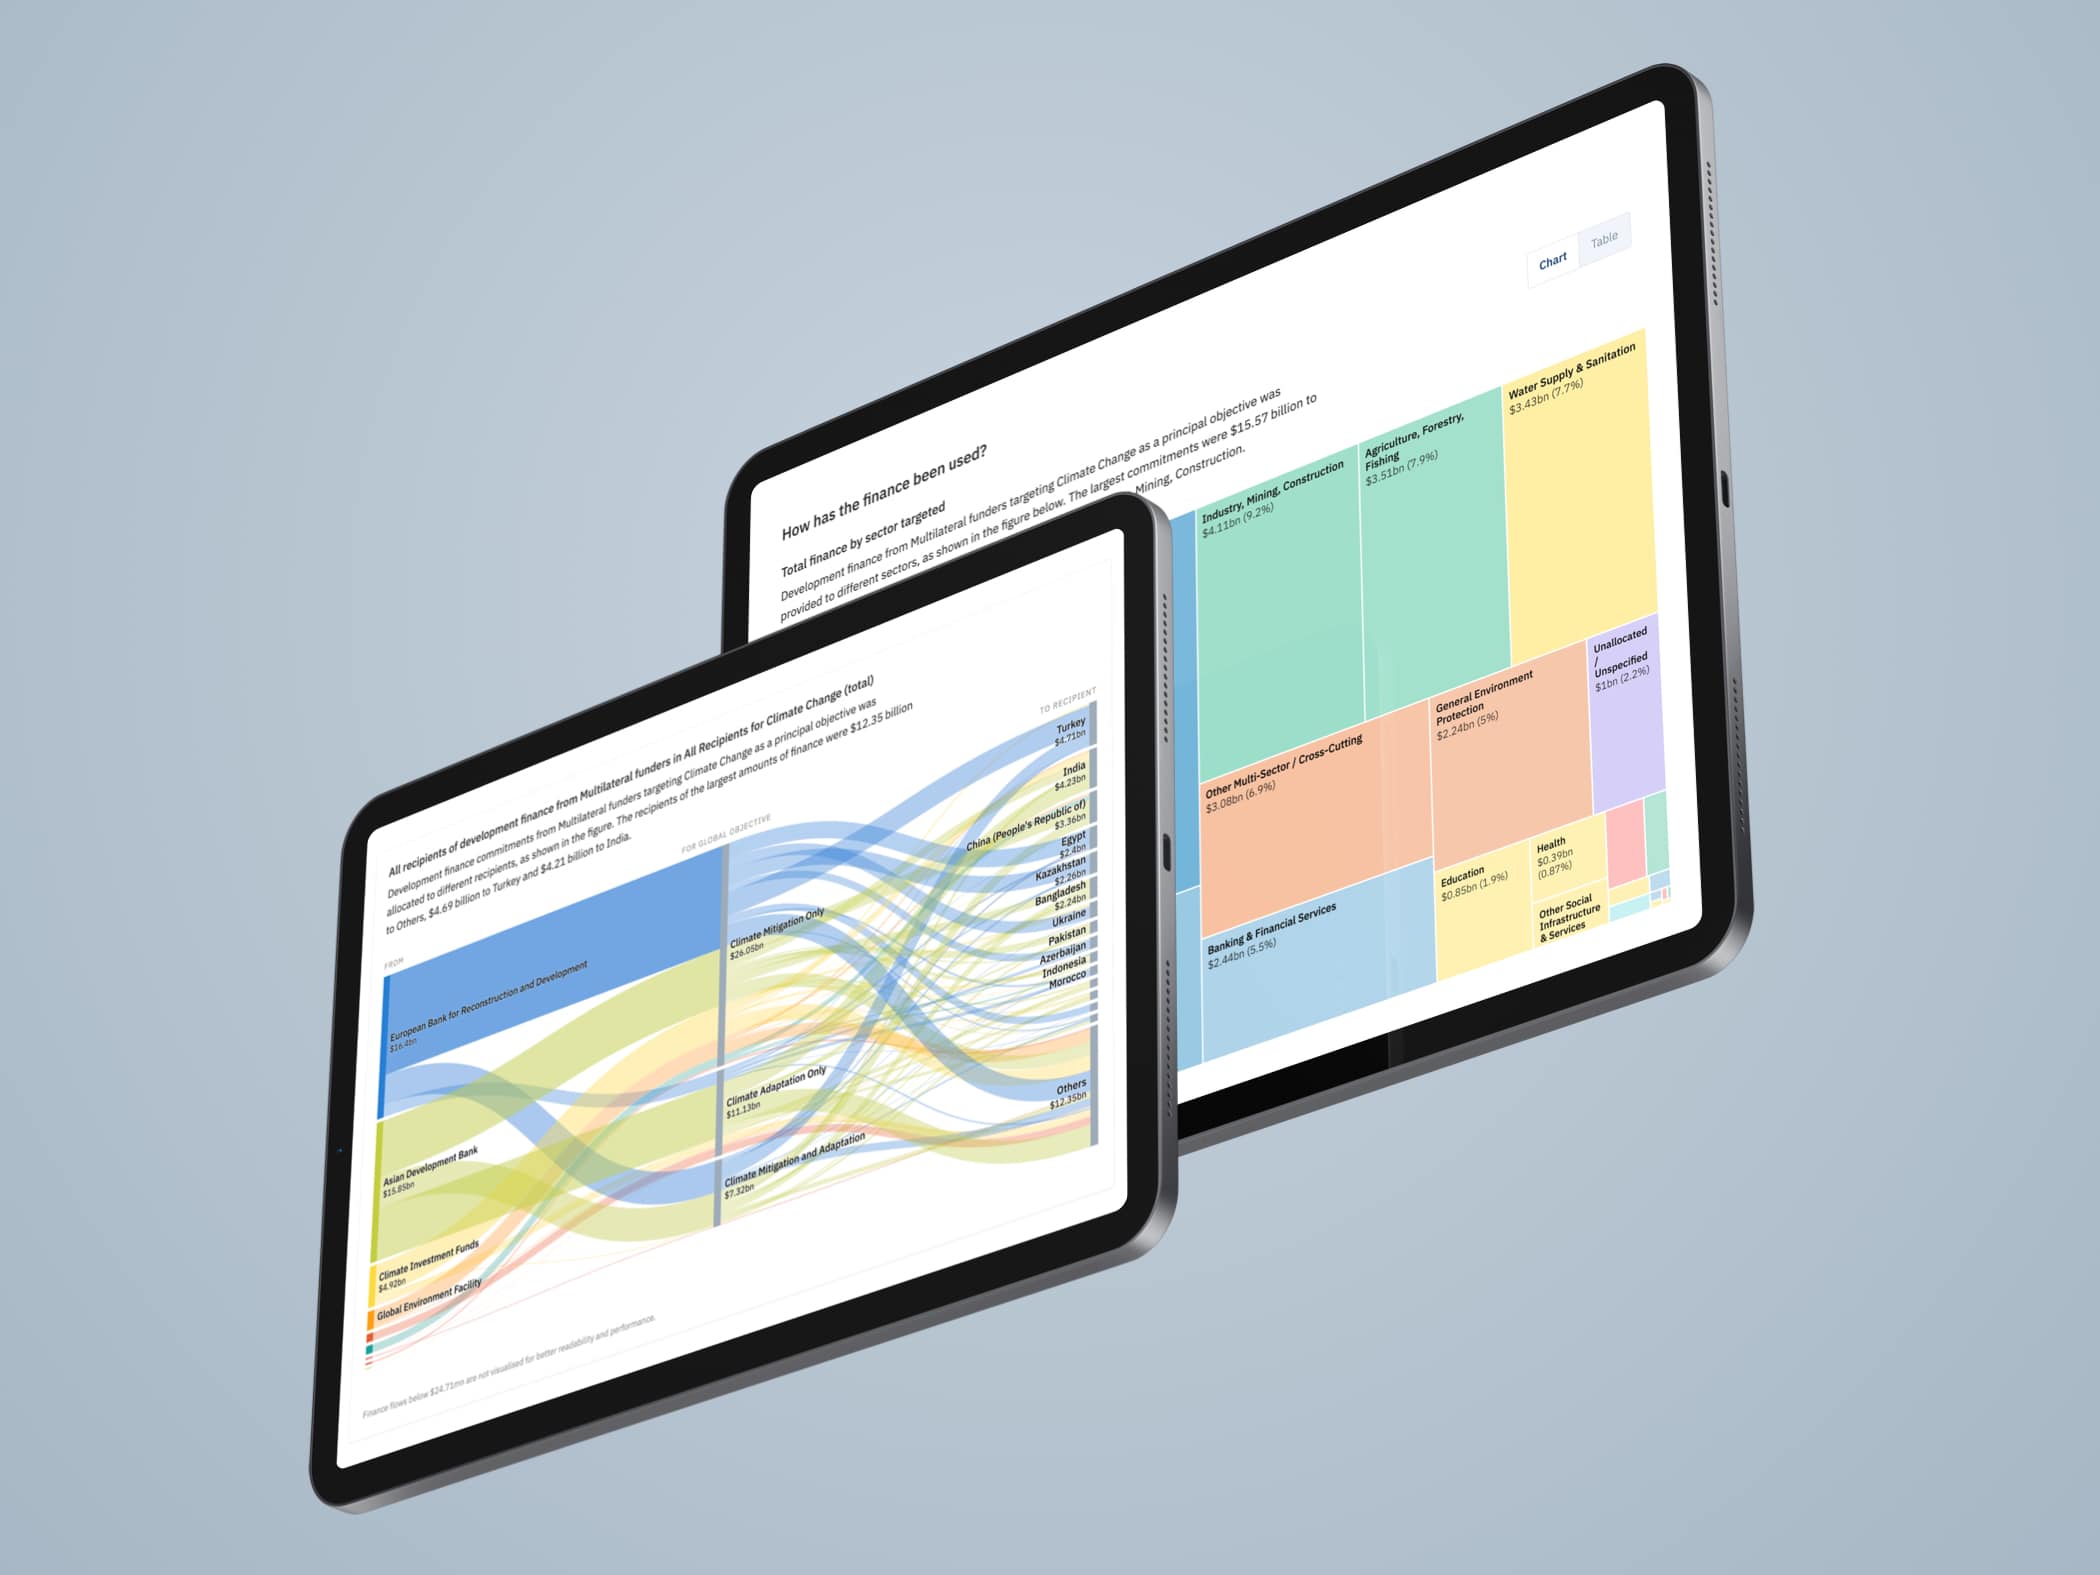
Colorful, intuitive data visualization for all devices.
We created several chart types such as an alluvial diagram, bar, stacked, donut, line charts and a treemap with a unique brand design and optimized them for all devices.


IMPACT
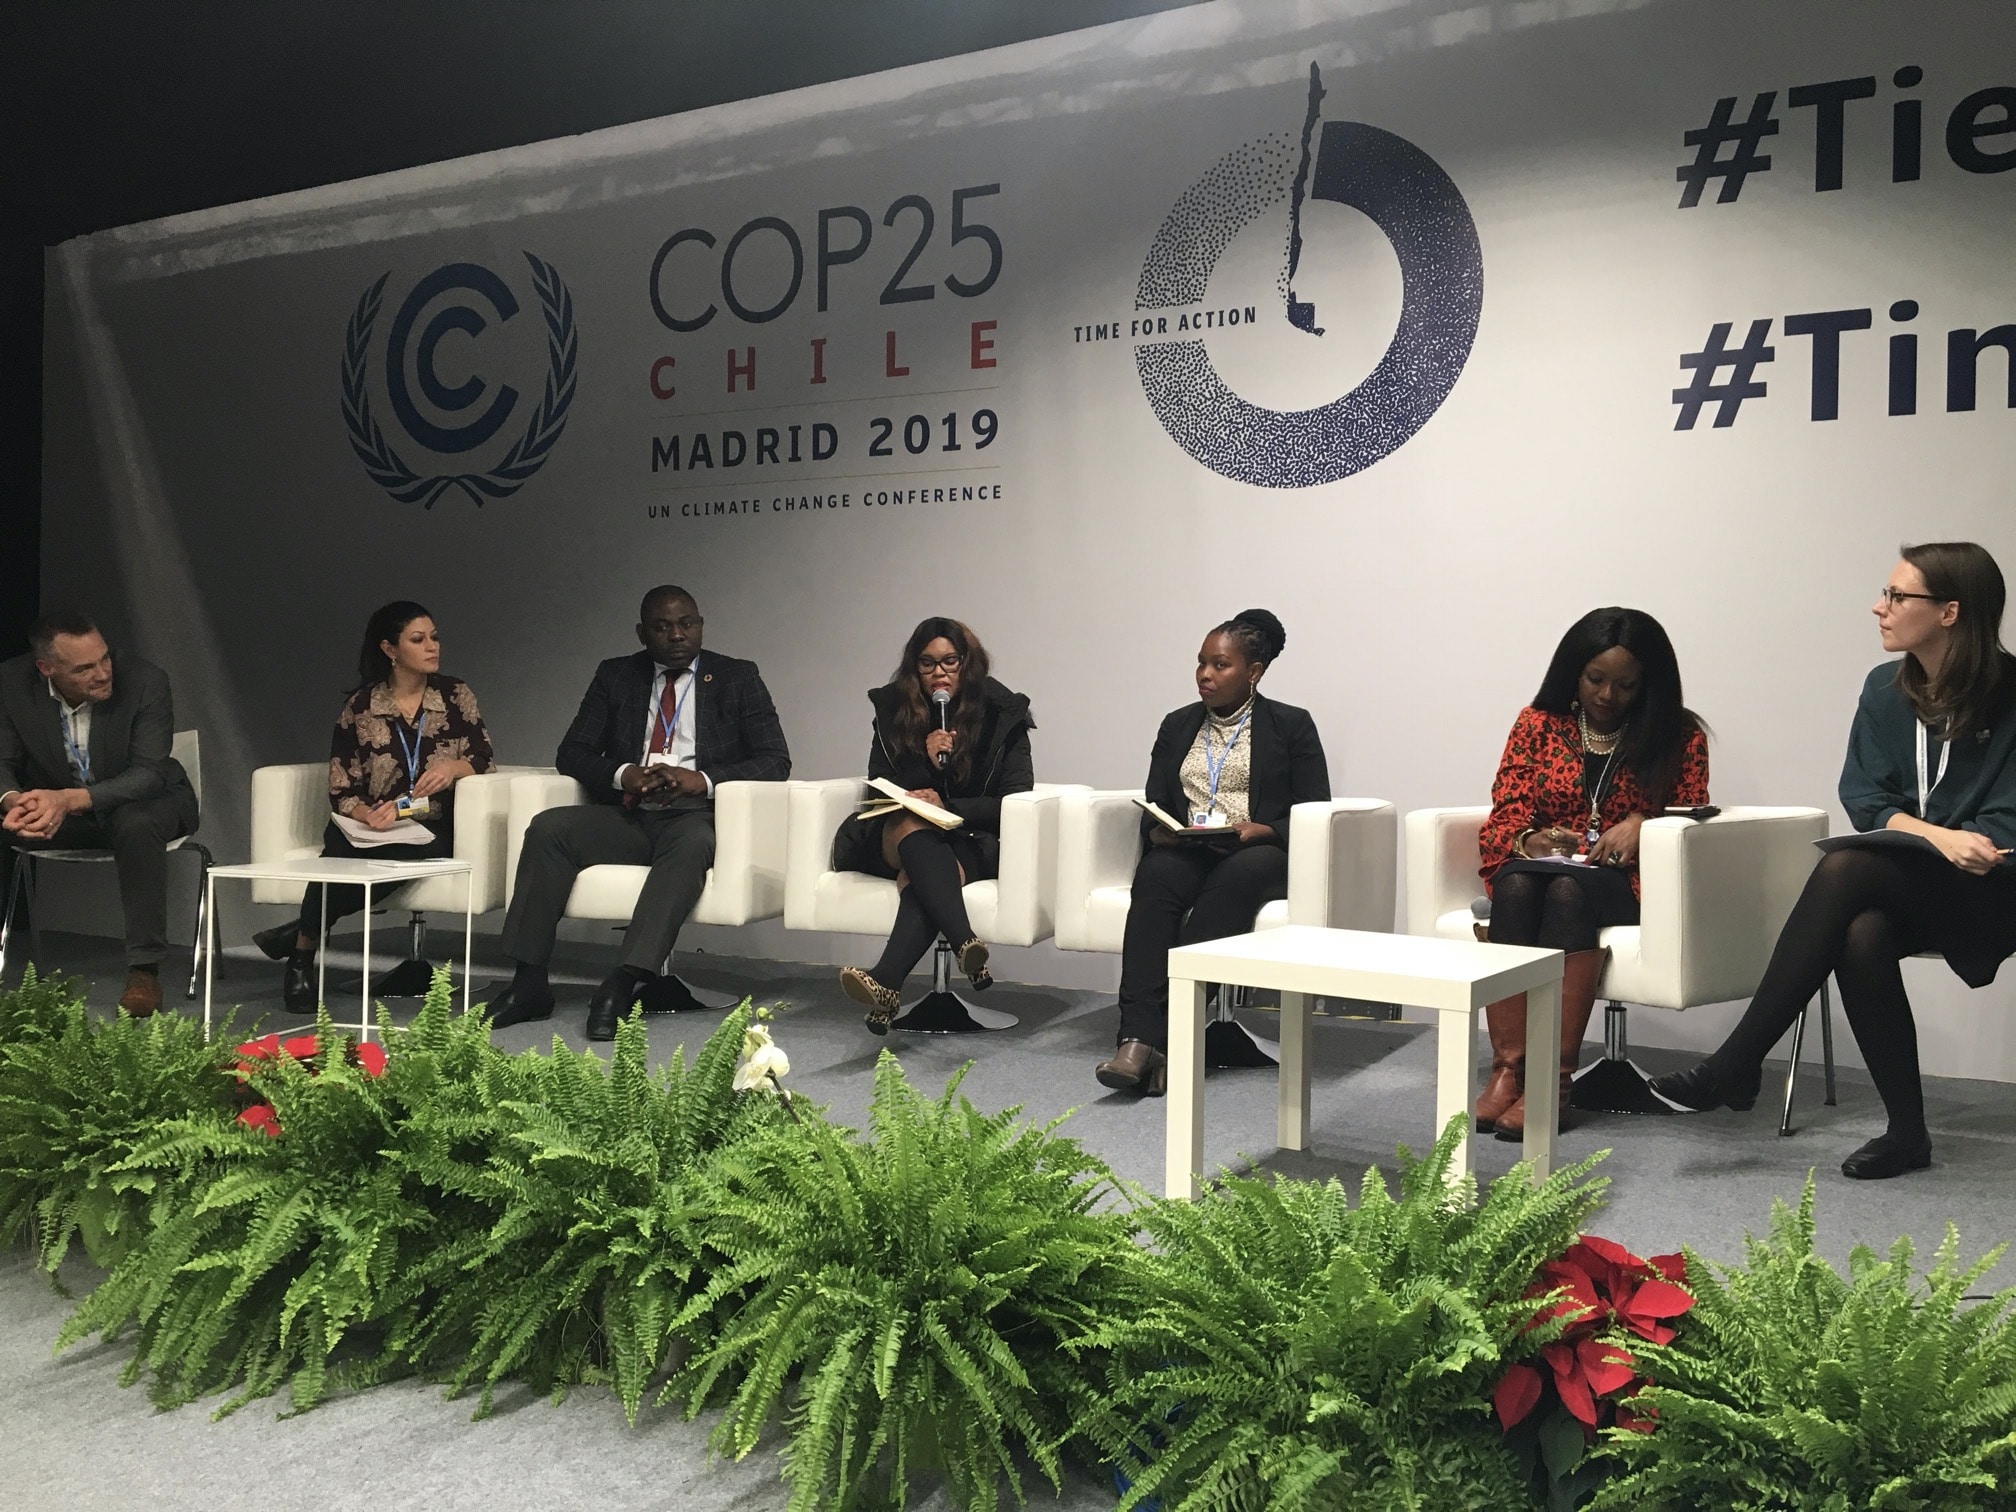
Launched at UN's COP25 in Madrid
Aid Atlas was launched at the United Nation Climate Change Conference 2019 COP25 in Madrid with several presentations, e.g. about oceans finance or discussions about "Empowering leaders to make ambitious decisions on climate action".
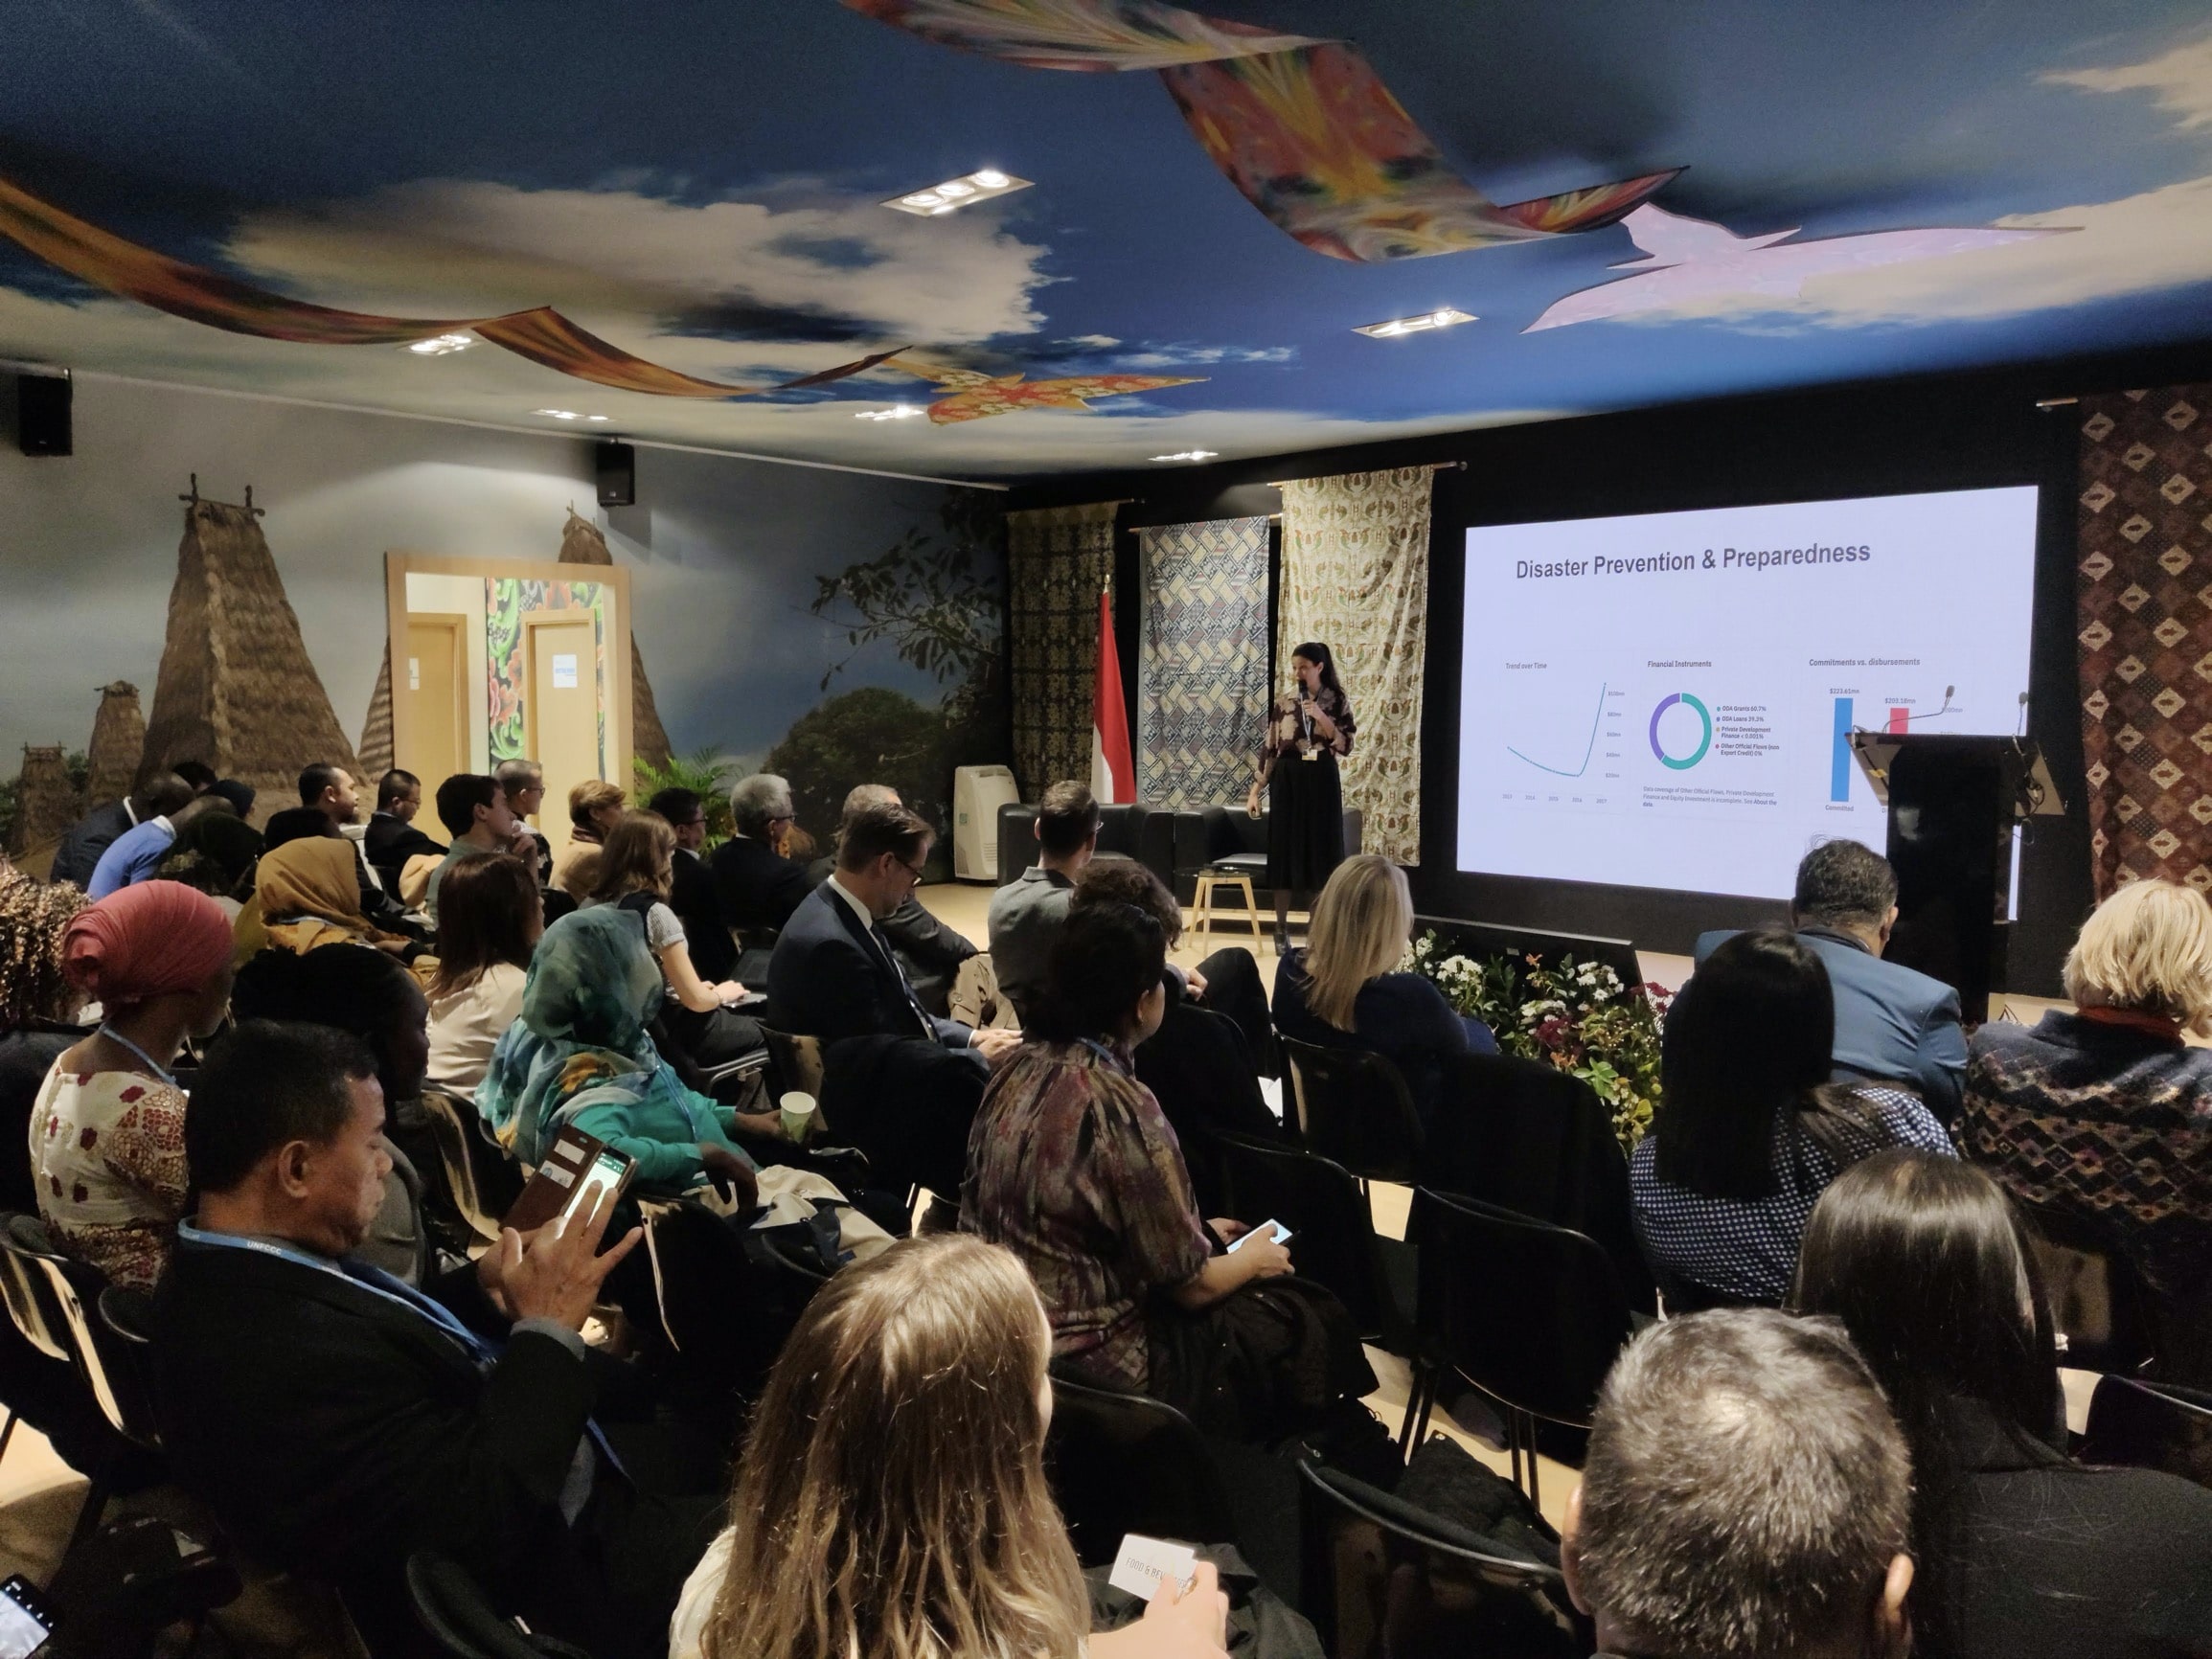
IMPACT
Used by policymakers around the world.
Teaser presented at UN's Technical Expert Meeting on Adaptation in the big plenary at the UNFCCC headquarters.
Officially launched at UN's COP25 Conference with several talks and discussions about development and climate finance.
Over 1,500 active users in the first months of release.

Get in touch to discuss what we could do for you.
© DataDesign Studio 2022. . All rights reserved.
For company information and other legal bits, see our legal page and Privacy Policy.