client
The migration in Germany changed fundamentally over the last decades: villages and small towns gained popularity again! How come, and who are these people?
We helped the Wüstenrot Foundation & Berlin-Institut to tell that compelling story with a "Scrollytelling" approach by transforming their static report into an interactive experience. In particular, the interactive data explorer, which allows users to retrieve data for all municipalities in Germany, has contributed to the project's great success.
Team
Sebastian Lühr (Sadowski)
Philipp Trenz
Team of the Berlin Institute for Population and Development
Release
June 2022
Interested?
insight
The trend to live in the countryside is proven by figures – but how could we tell that story?
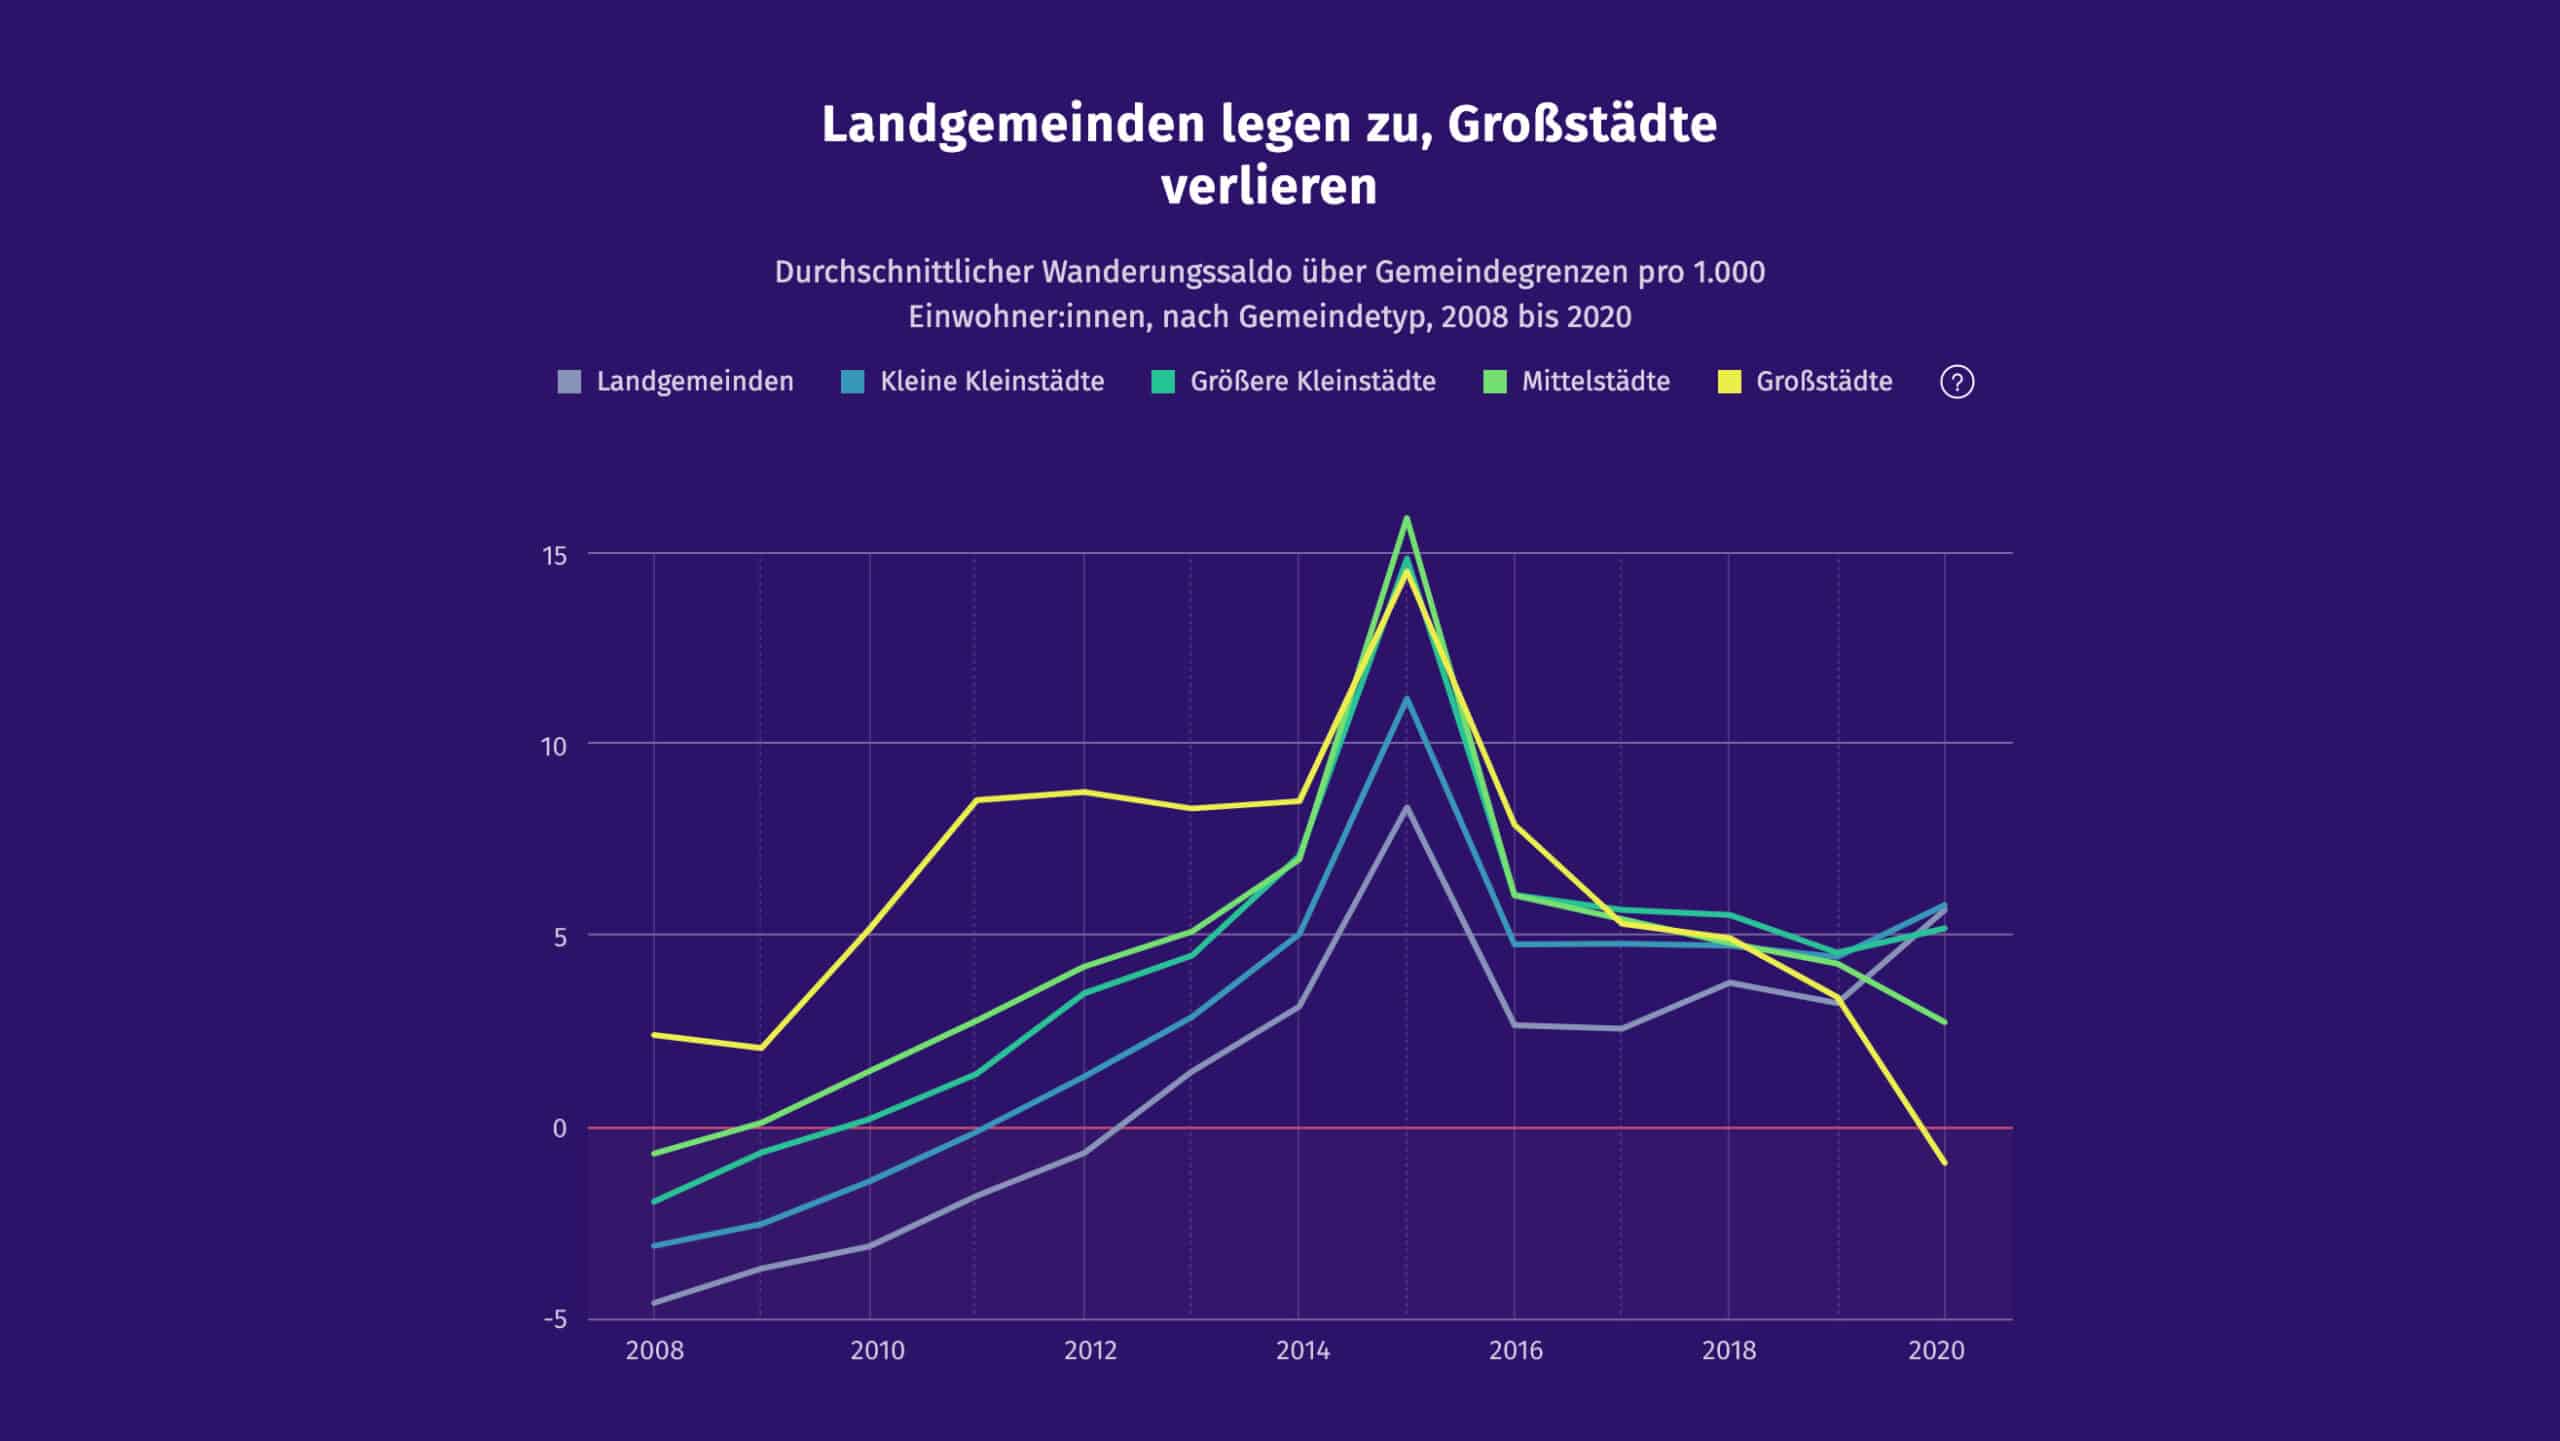
For about two decades, people moved mainly to the big cities, while many rural regions lost inhabitants. For some years now, however, there have been signs of a trend reversal. Villages and small towns are once again gaining in popularity as places to live, and not just since the Coronavirus shook up many a life plan.
But do the people who express a desire for a life in the countryside actually put it into practice?
To find out, the Berlin Institute and the Wüstenrot Foundation have taken a close look at migration patterns in recent years.
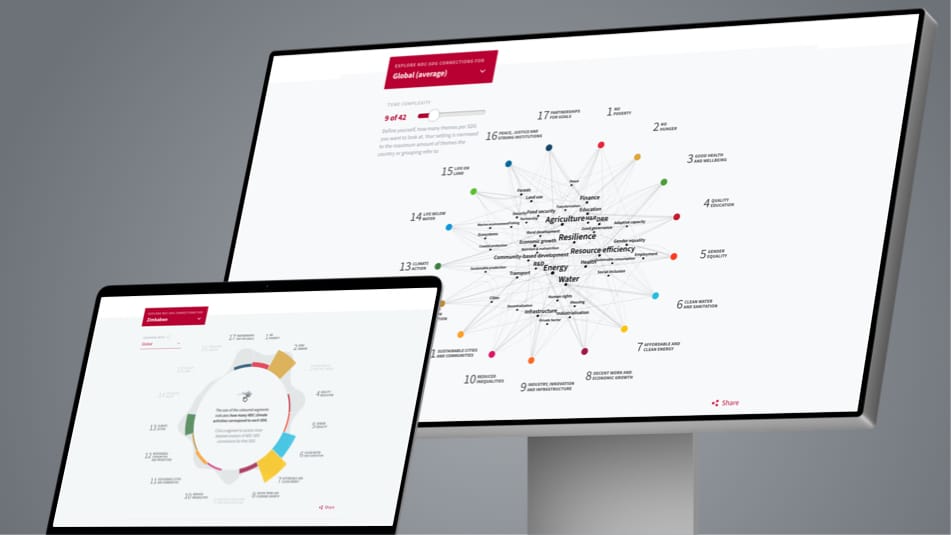
The key findings of that analysis accompanied by visualizations such as maps, lines, or bar charts have been presented attractively on one web page, always prompting users to scroll further.
We managed to get everything done in just 6 weeks from the kick-off workshop to the press conference.
ui/ux design
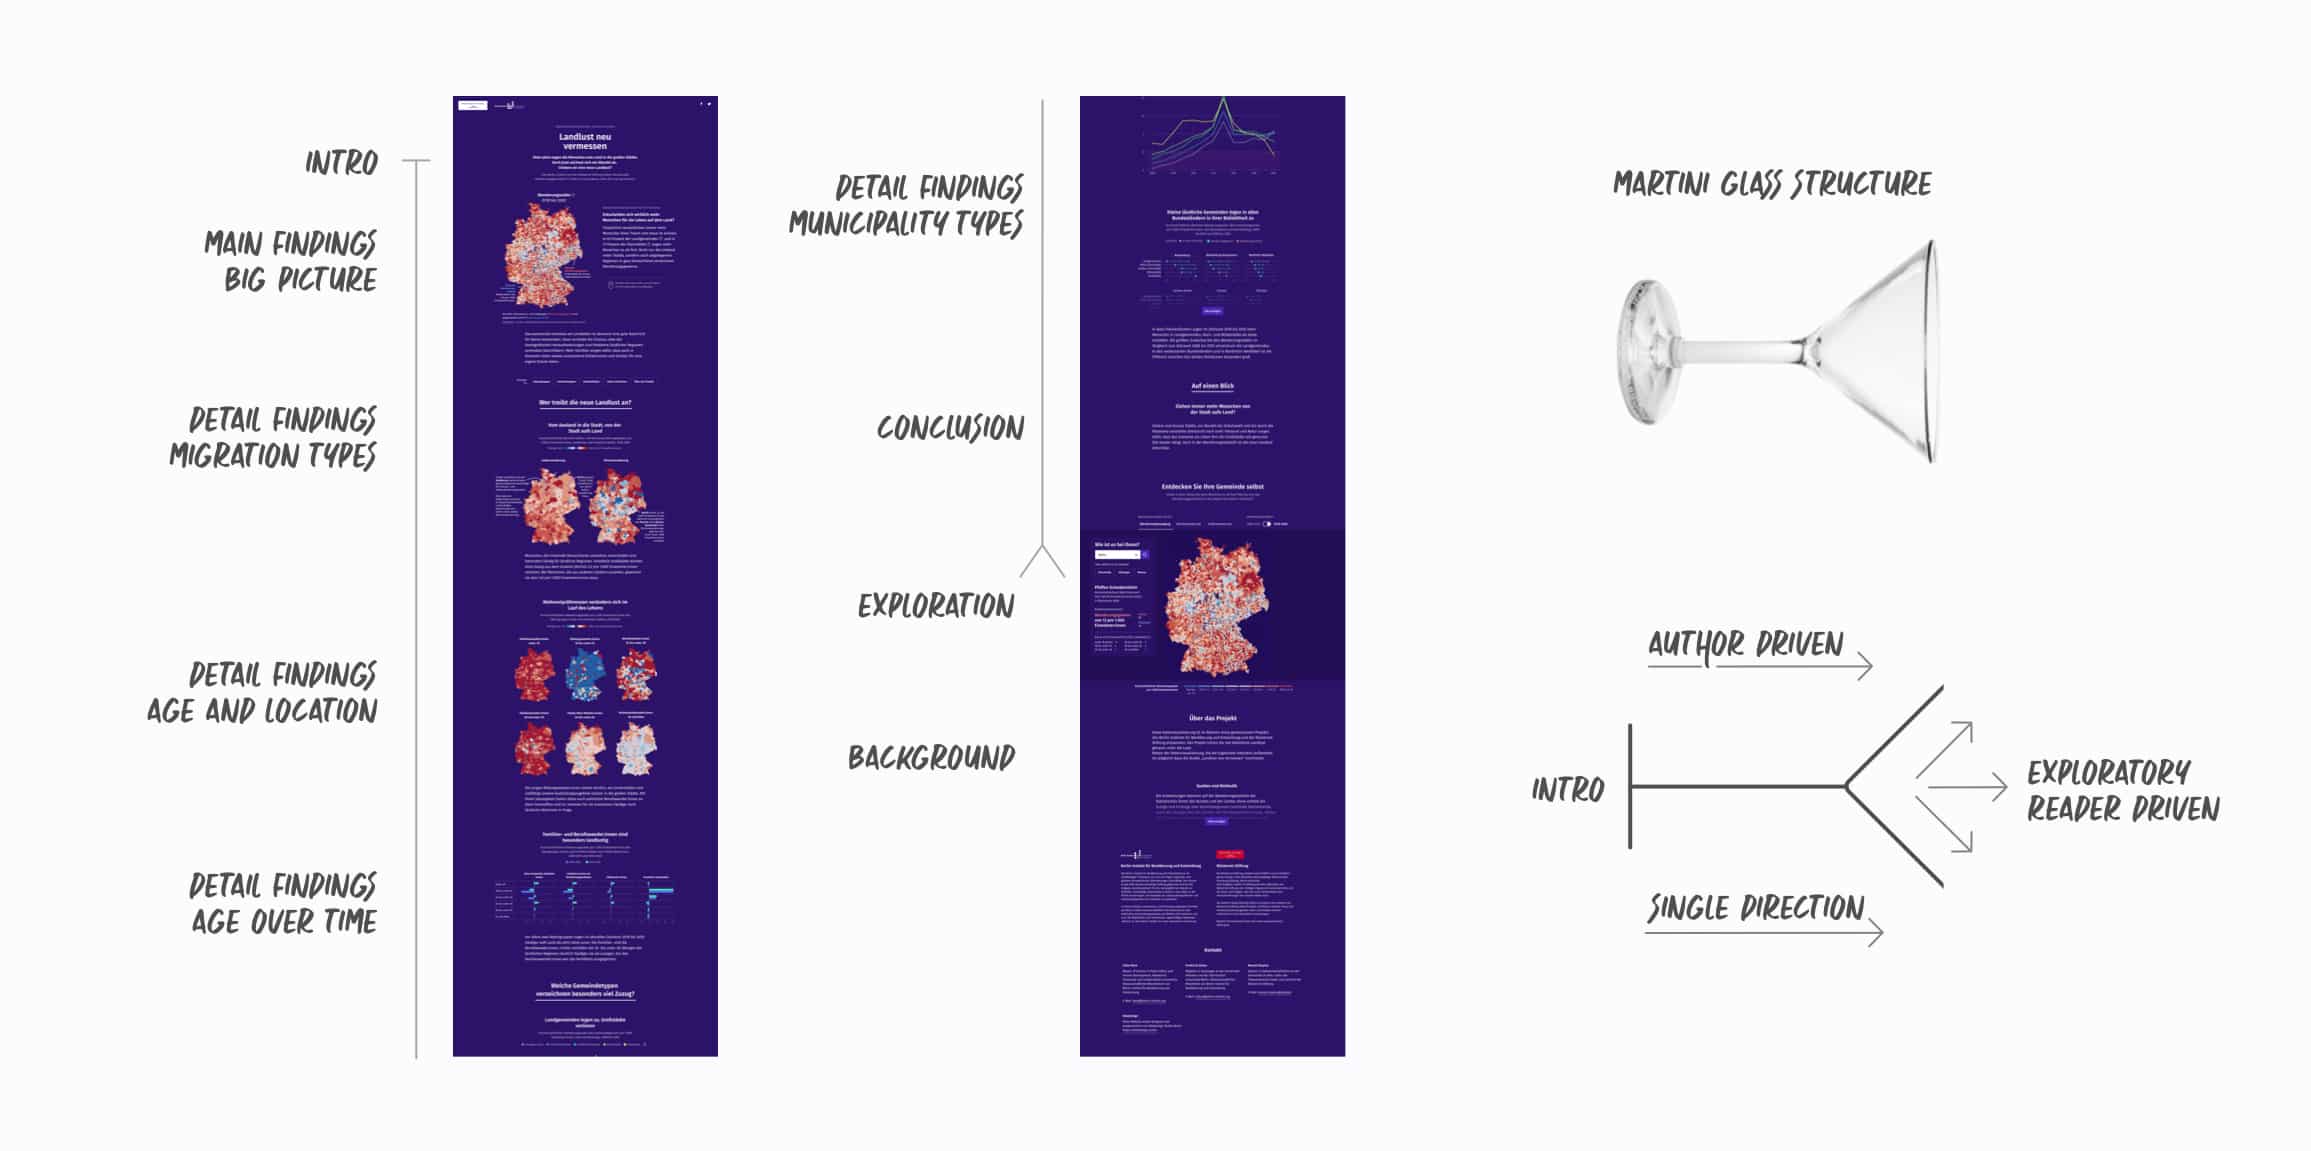
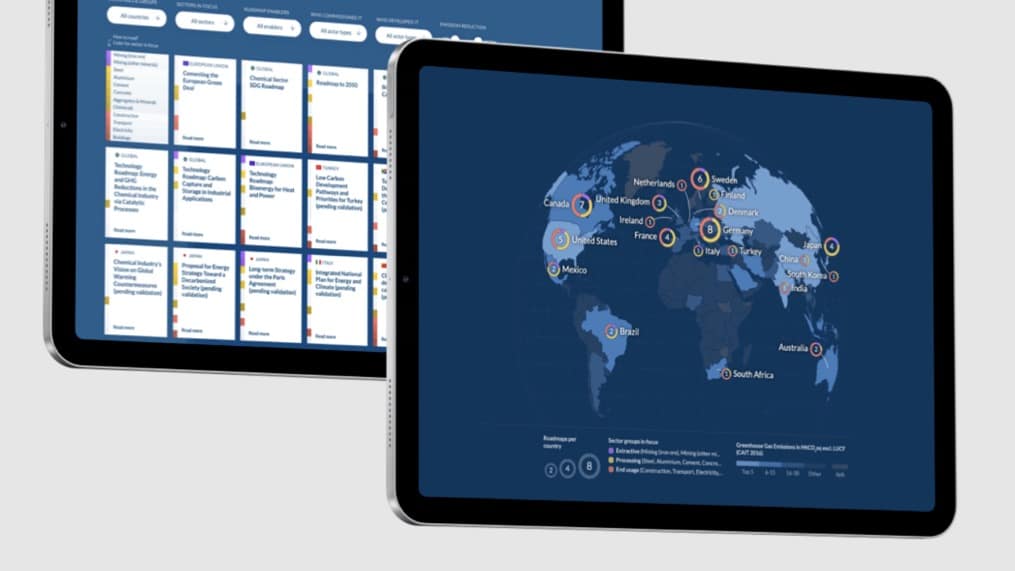
Explain and then let the reader explore.
For our briefing, we've got a lot of data and some first analysis and insights. One of our first tasks was, to find out, how to tell that story. We've organized a kick-off workshop where we agreed to design one long web page with the Martini-glass structure of storytelling: we introduce the user to the topic with a wide overview, focus on some detailed findings with a single, narrative direction, and then at the end, let the users explore the data themselves.
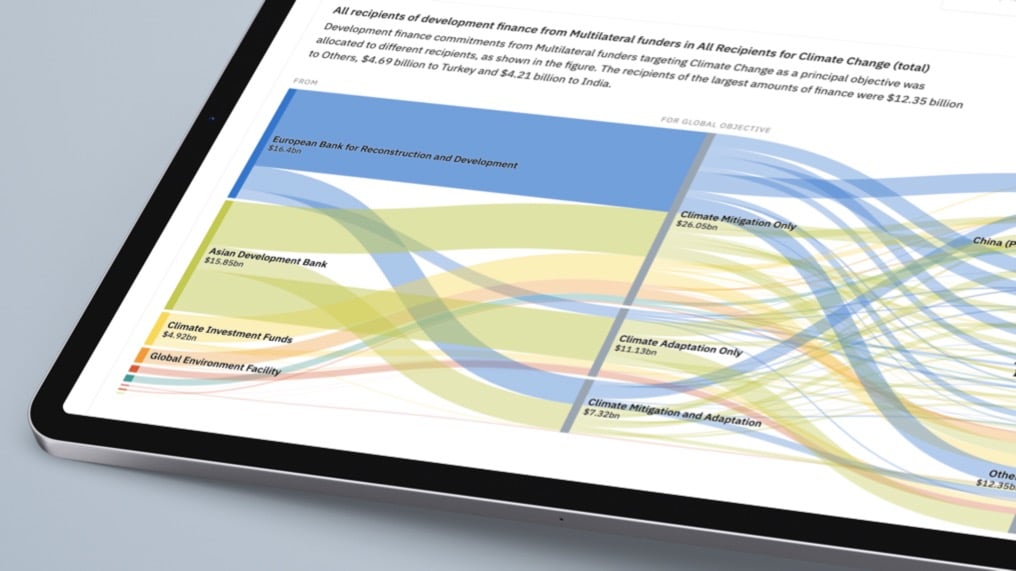
DATA VISUALIZATION DESIGN
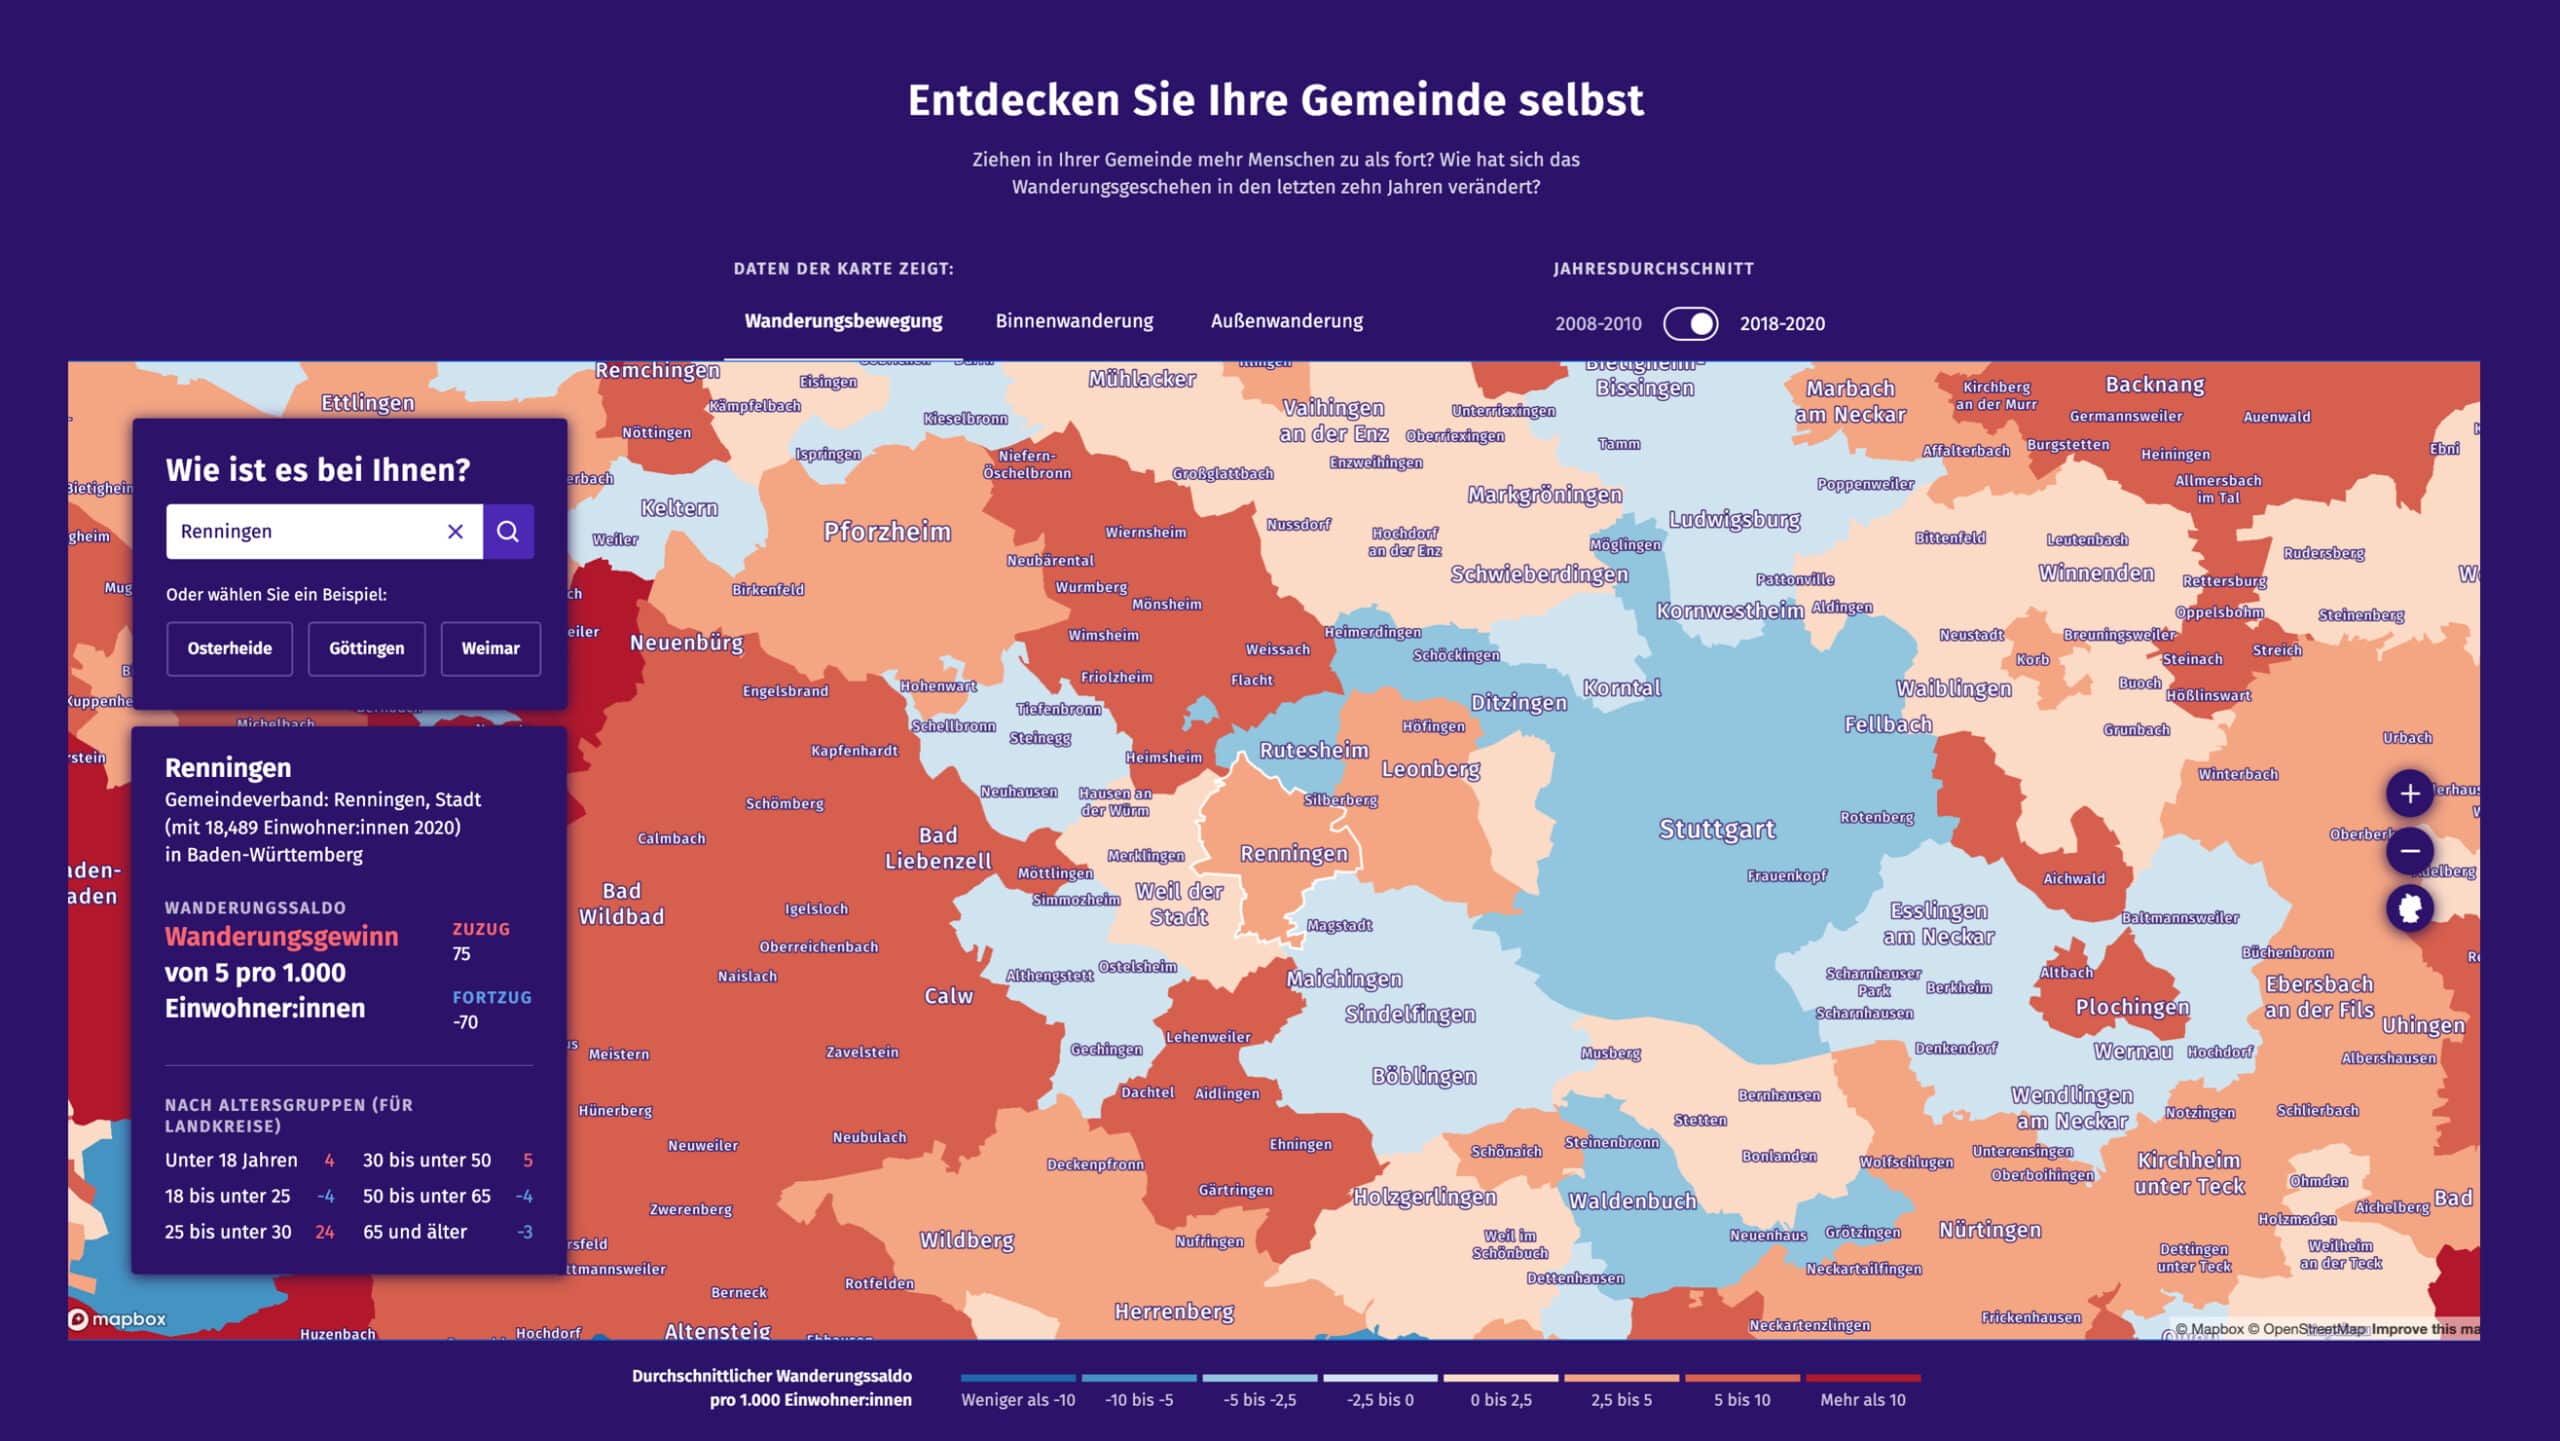
Detailed maps showing migration in Germany as never seen before.
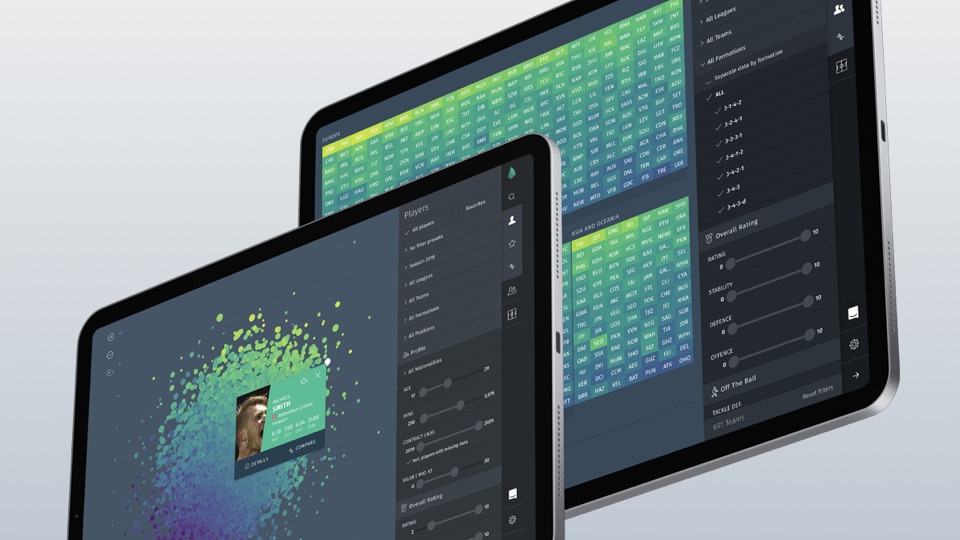
We used maps of Germany colored by municipalities to compare them with the migration 10 years ago, but also to other data such as population development. Other data visualization helps the user to deep dive into the data by their age group or state.


IMPACT
Press articles in plenty of print newspapers and online portals in Germany.
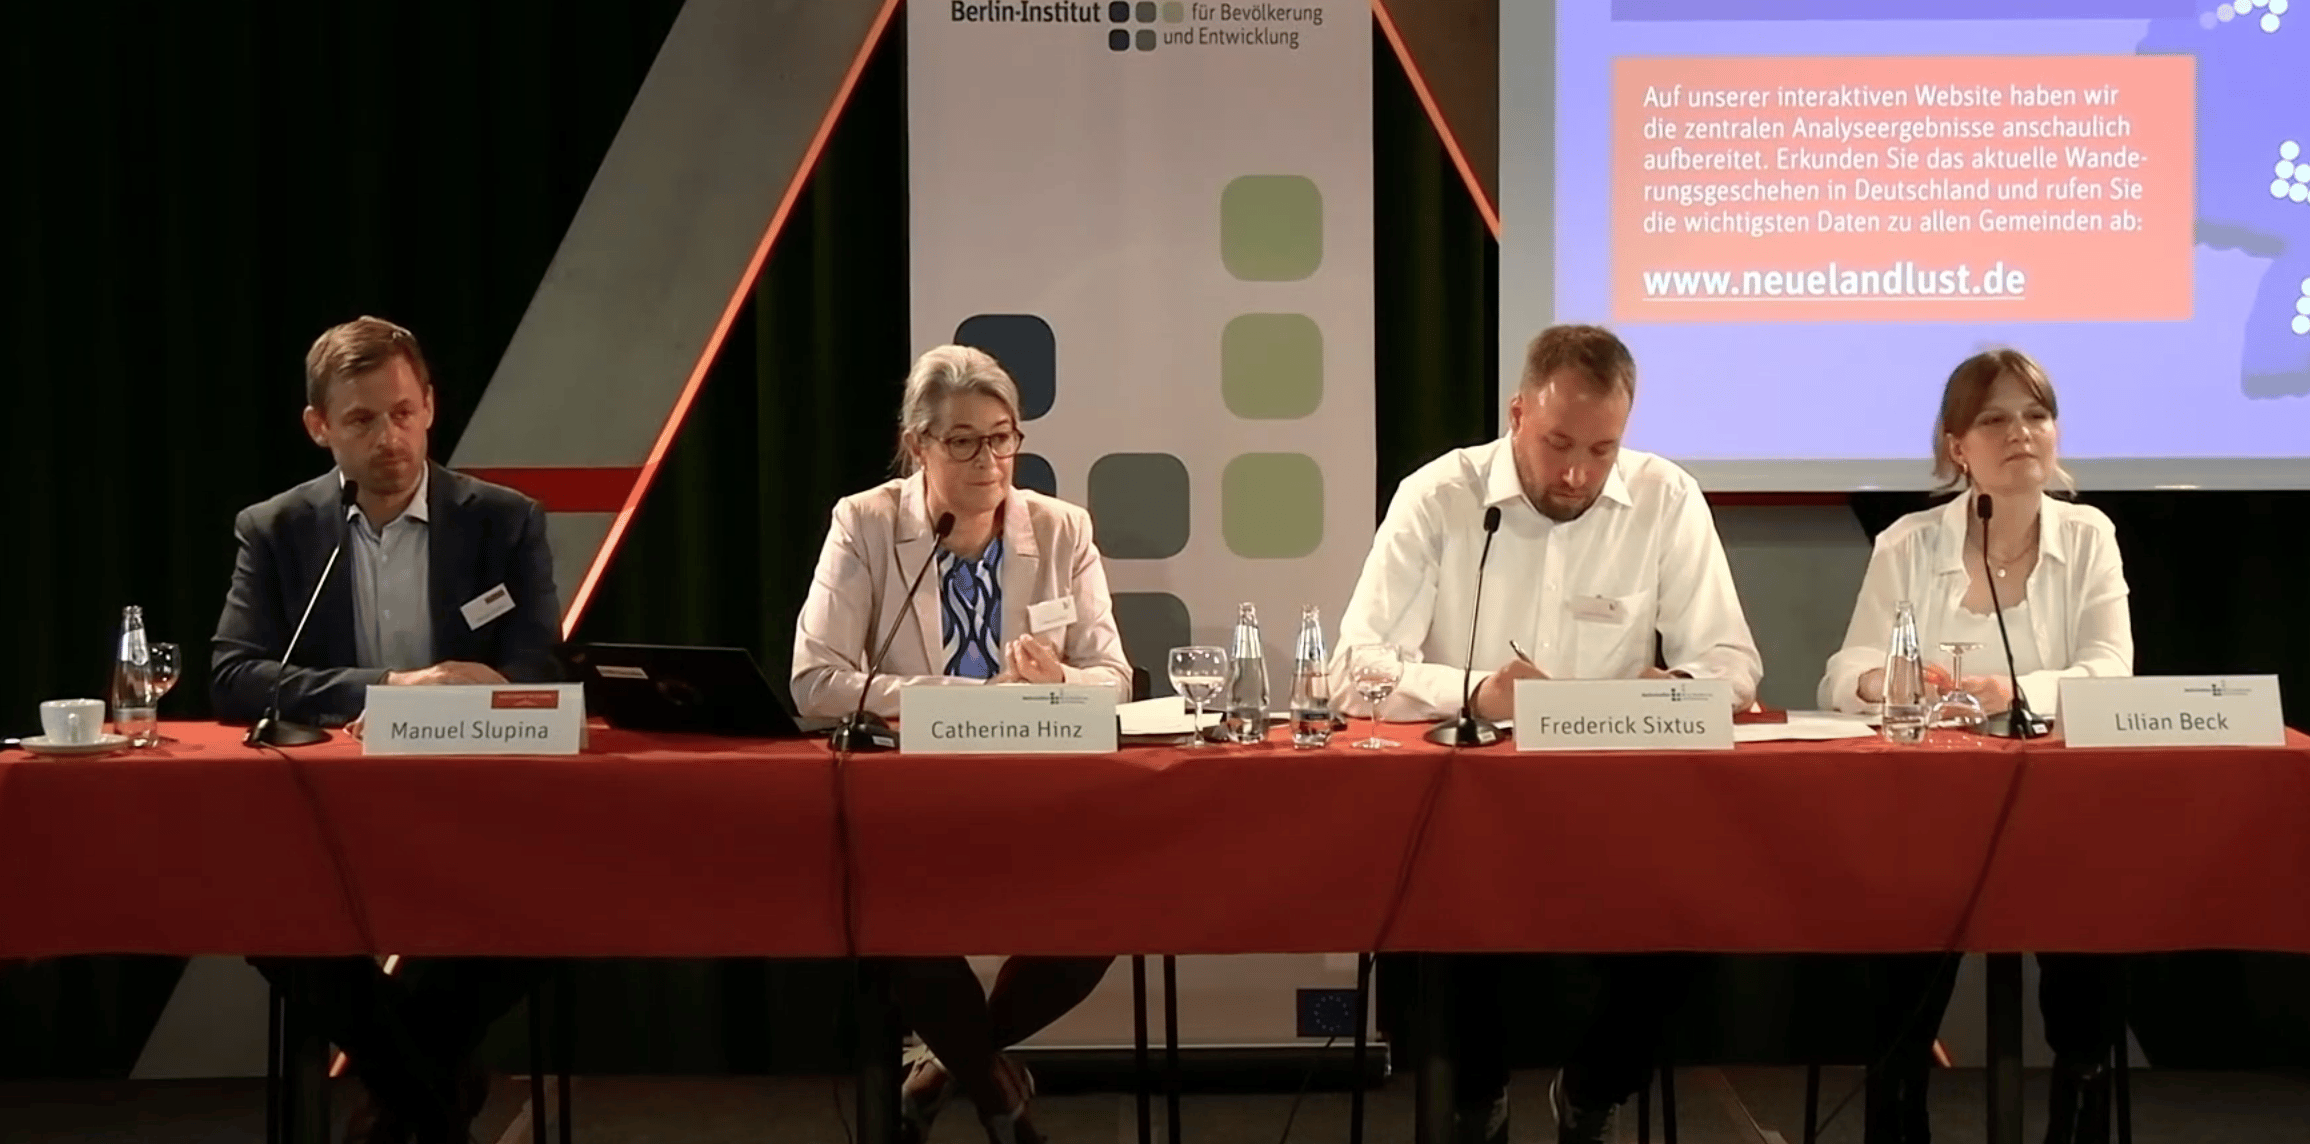
Successful press conference in Berlin showcasing the key insights and getting feedback from the audience.
The data visualizations were printed in various newspapers. Among others, also on the cover page of the "Berliner Morgenpost".
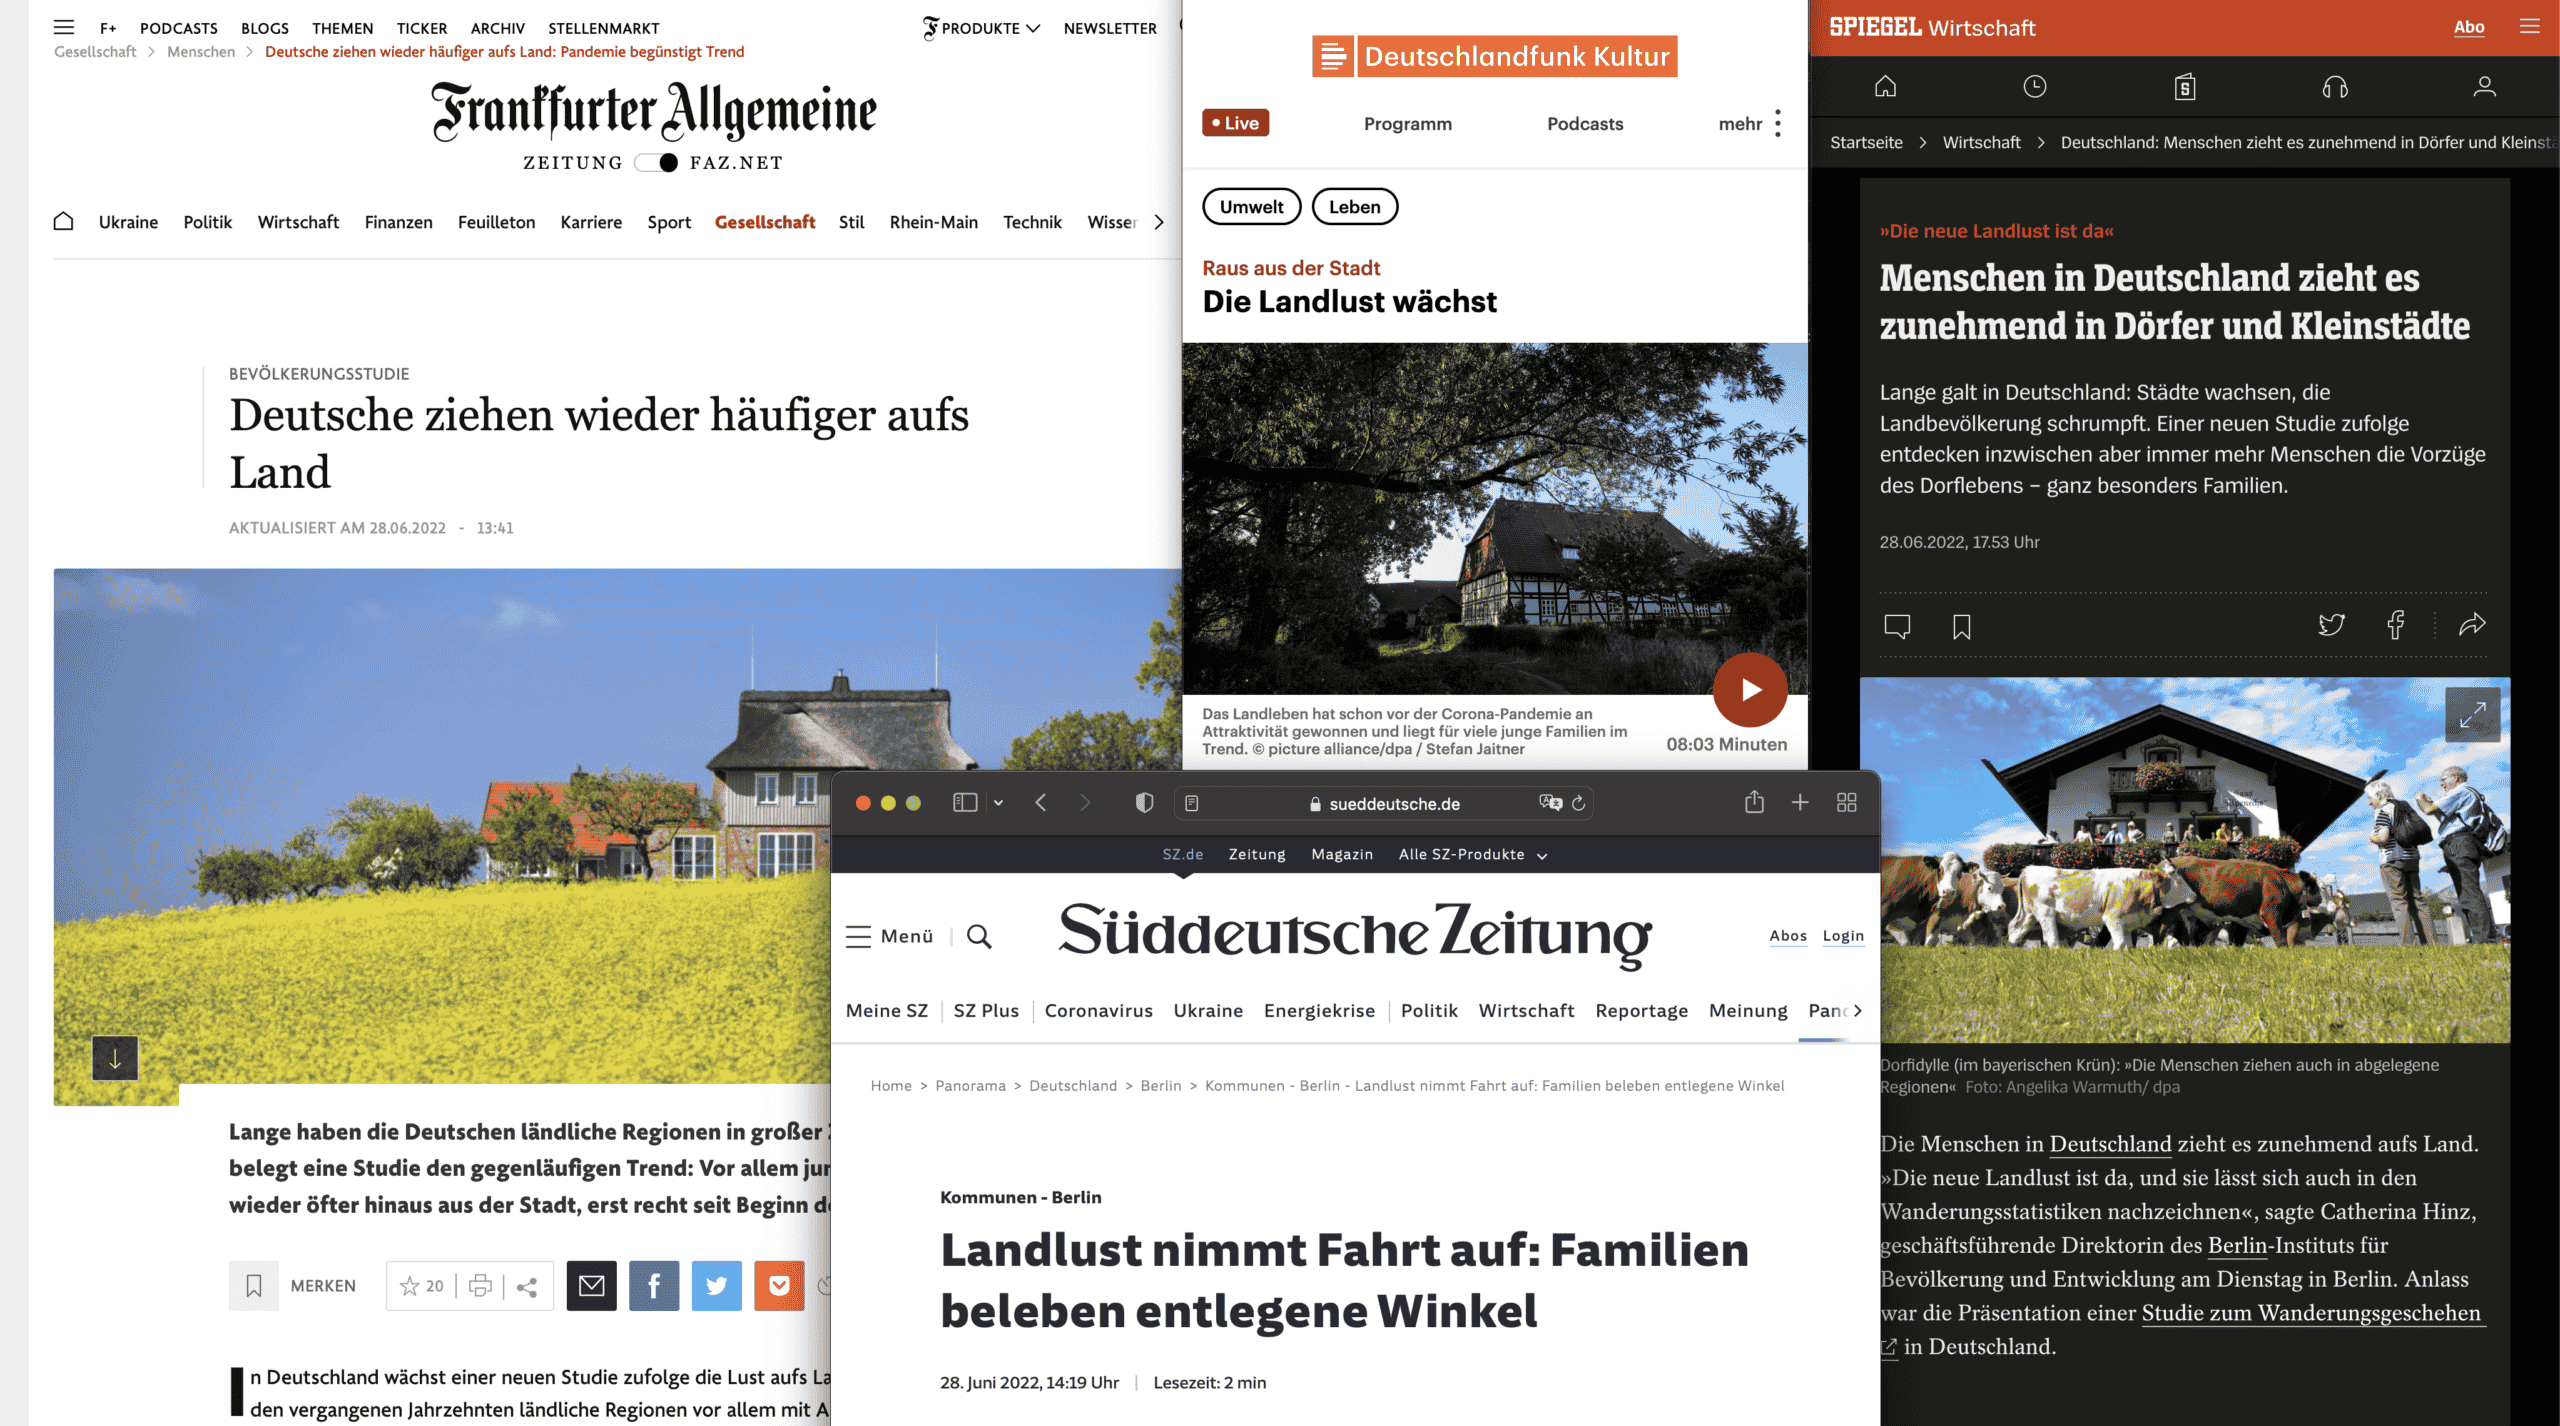
Press articles in many German media, such as "Der Spiegel", "Frankfurter Allgemeine Zeitung", Süddeutsche Zeitung" or podcast such at "Deutschlandfunk Kultur".

Get in touch to discuss what we could do for you.
© DataDesign Studio 2022. . All rights reserved.
For company information and other legal bits, see our legal page and Privacy Policy.